Figure 4. Expression of M-opsin
protein in the retina after treatment with several types of
protease inhibitors for 24 h in retinal explants. M-opsin
protein levels were analyzed with western blotting after
treatment with (A) pepstatin A, (B) E64d, and (C)
MG-132. D: Effect of MG-132 on M-opsin, S-opsin, GNAT2,
GNAT1, and rhodopsin at the protein level analyzed with western
blotting. E: Quantitative analysis of M-opsin protein
level. F: Immunohistochemistry in MG-132-treated retinas
for 24 h showed M-opsin (red). Cell nuclei were contrasted with
DAPI (blue). M-opsin-positive cells increased after treatment
with 2 μM or 10 μM MG-132 compared with vehicle in cone outer
segments (arrows), ONL, and OPL (arrowheads) in the retina. G:
Densitometric analysis of immunofluorescence probed anti-M-opsin
antibody in a 400-μm-wide section of retina. Histograms indicate
mean±SD (n=6). *p<0.05, **p<0.01, ***p<0.001. RPE,
retinal pigment epithelium; OS, outer segment; ONL, outer
nuclear layer; OPL, outer plexiform layer. Scale bars, 50 μm.
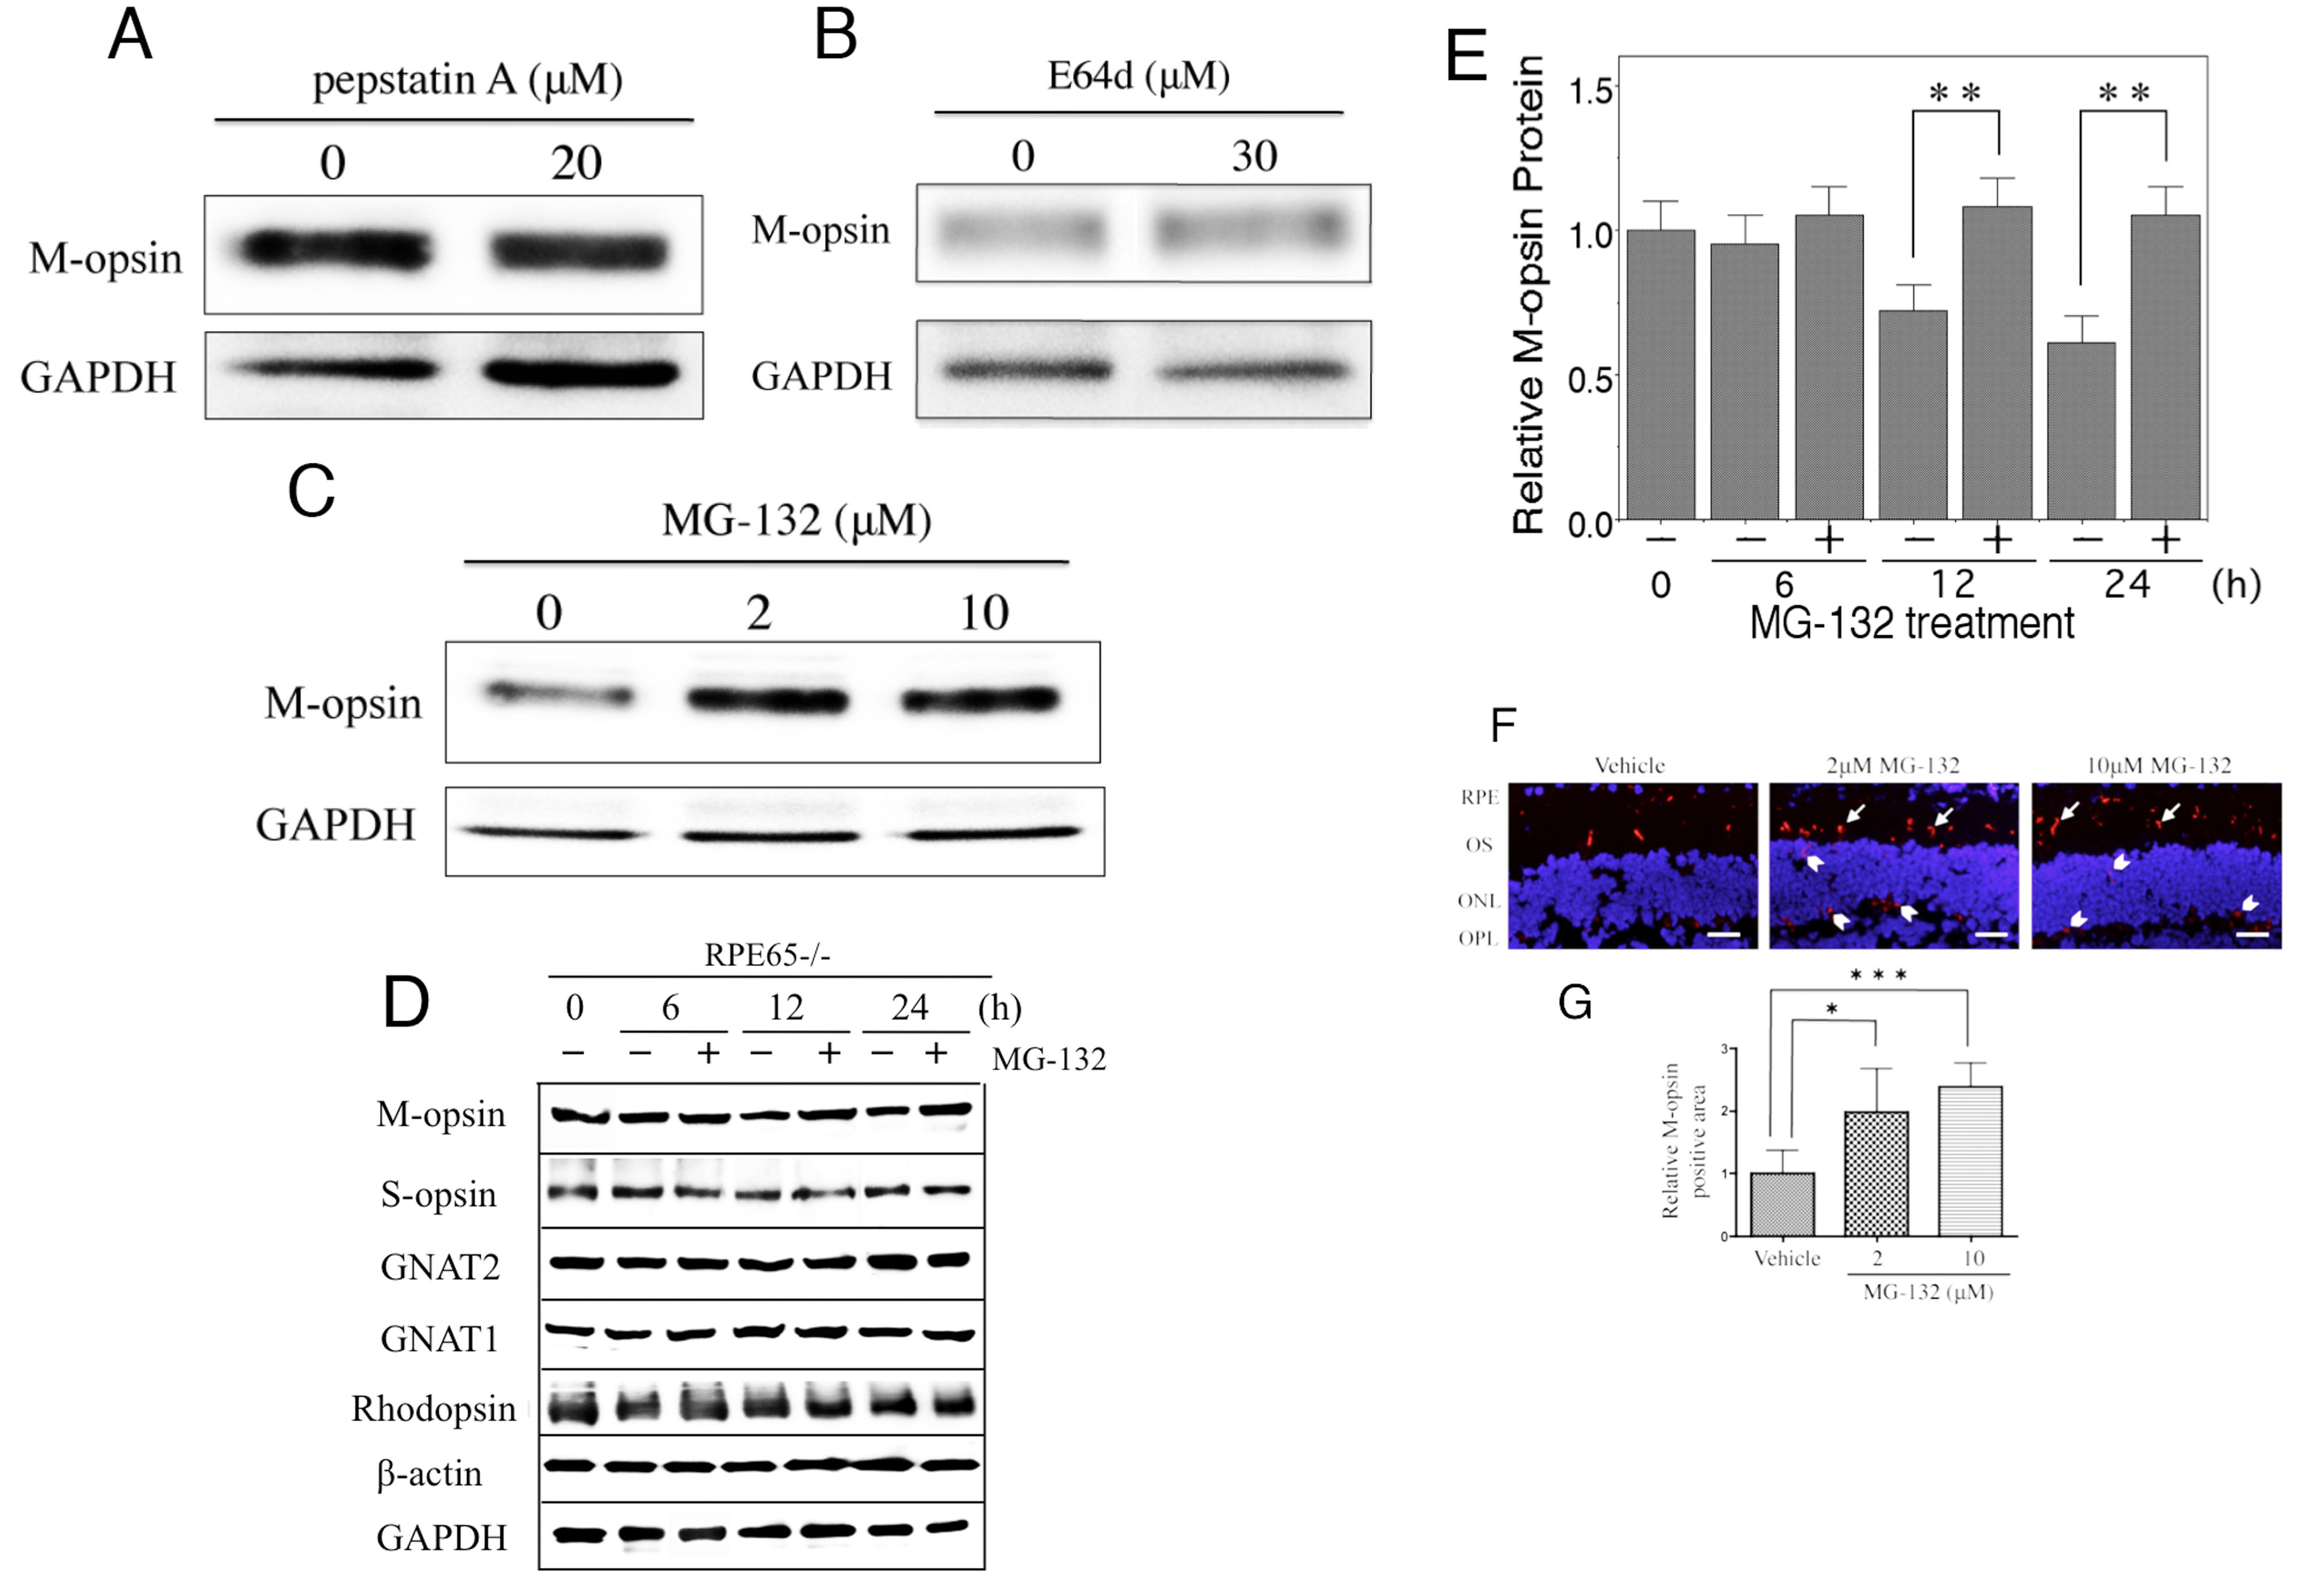
 Figure 4
of Sato, Mol Vis 2012; 18:1516-1525.
Figure 4
of Sato, Mol Vis 2012; 18:1516-1525.