Figure 3. Western blotting and
immunohistochemistry analysis of M-opsin expression treated with
a protease inhibitor mixture (20 μM pepstatin A, 30 μM E64d, and
10 μM MG-132) for 24 h in Rpe65−/− mice in
retinal explants. A: Immunoblots were performed using
retina-RPE choroids treated with the protease inhibitor mixture.
A loading control with GAPDH was included for each immunoblot. B:
Immunolocalization of M-opsin protein in the retina treated with
a protease inhibitor mixture. M-opsin was stained with
polyclonal anti-M-opsin antibody (red), and cell nuclei were
labeled with DNA-binding dye DAPI (blue). The number of
immunoreactive products increased in the cone outer segments
(arrows), ONL, and OPL (arrowheads). C: Histograms
showing the area of immunoreactivity of M-opsin in a 400-μm-wide
section of the retina. Data are expressed as the mean±SD (n=6).
*p<0.05. RPE, retinal pigment epithelium; OS, outer segment;
ONL, outer nuclear layer; OPL, outer plexiform layer. Scale
bars, 50 μm.
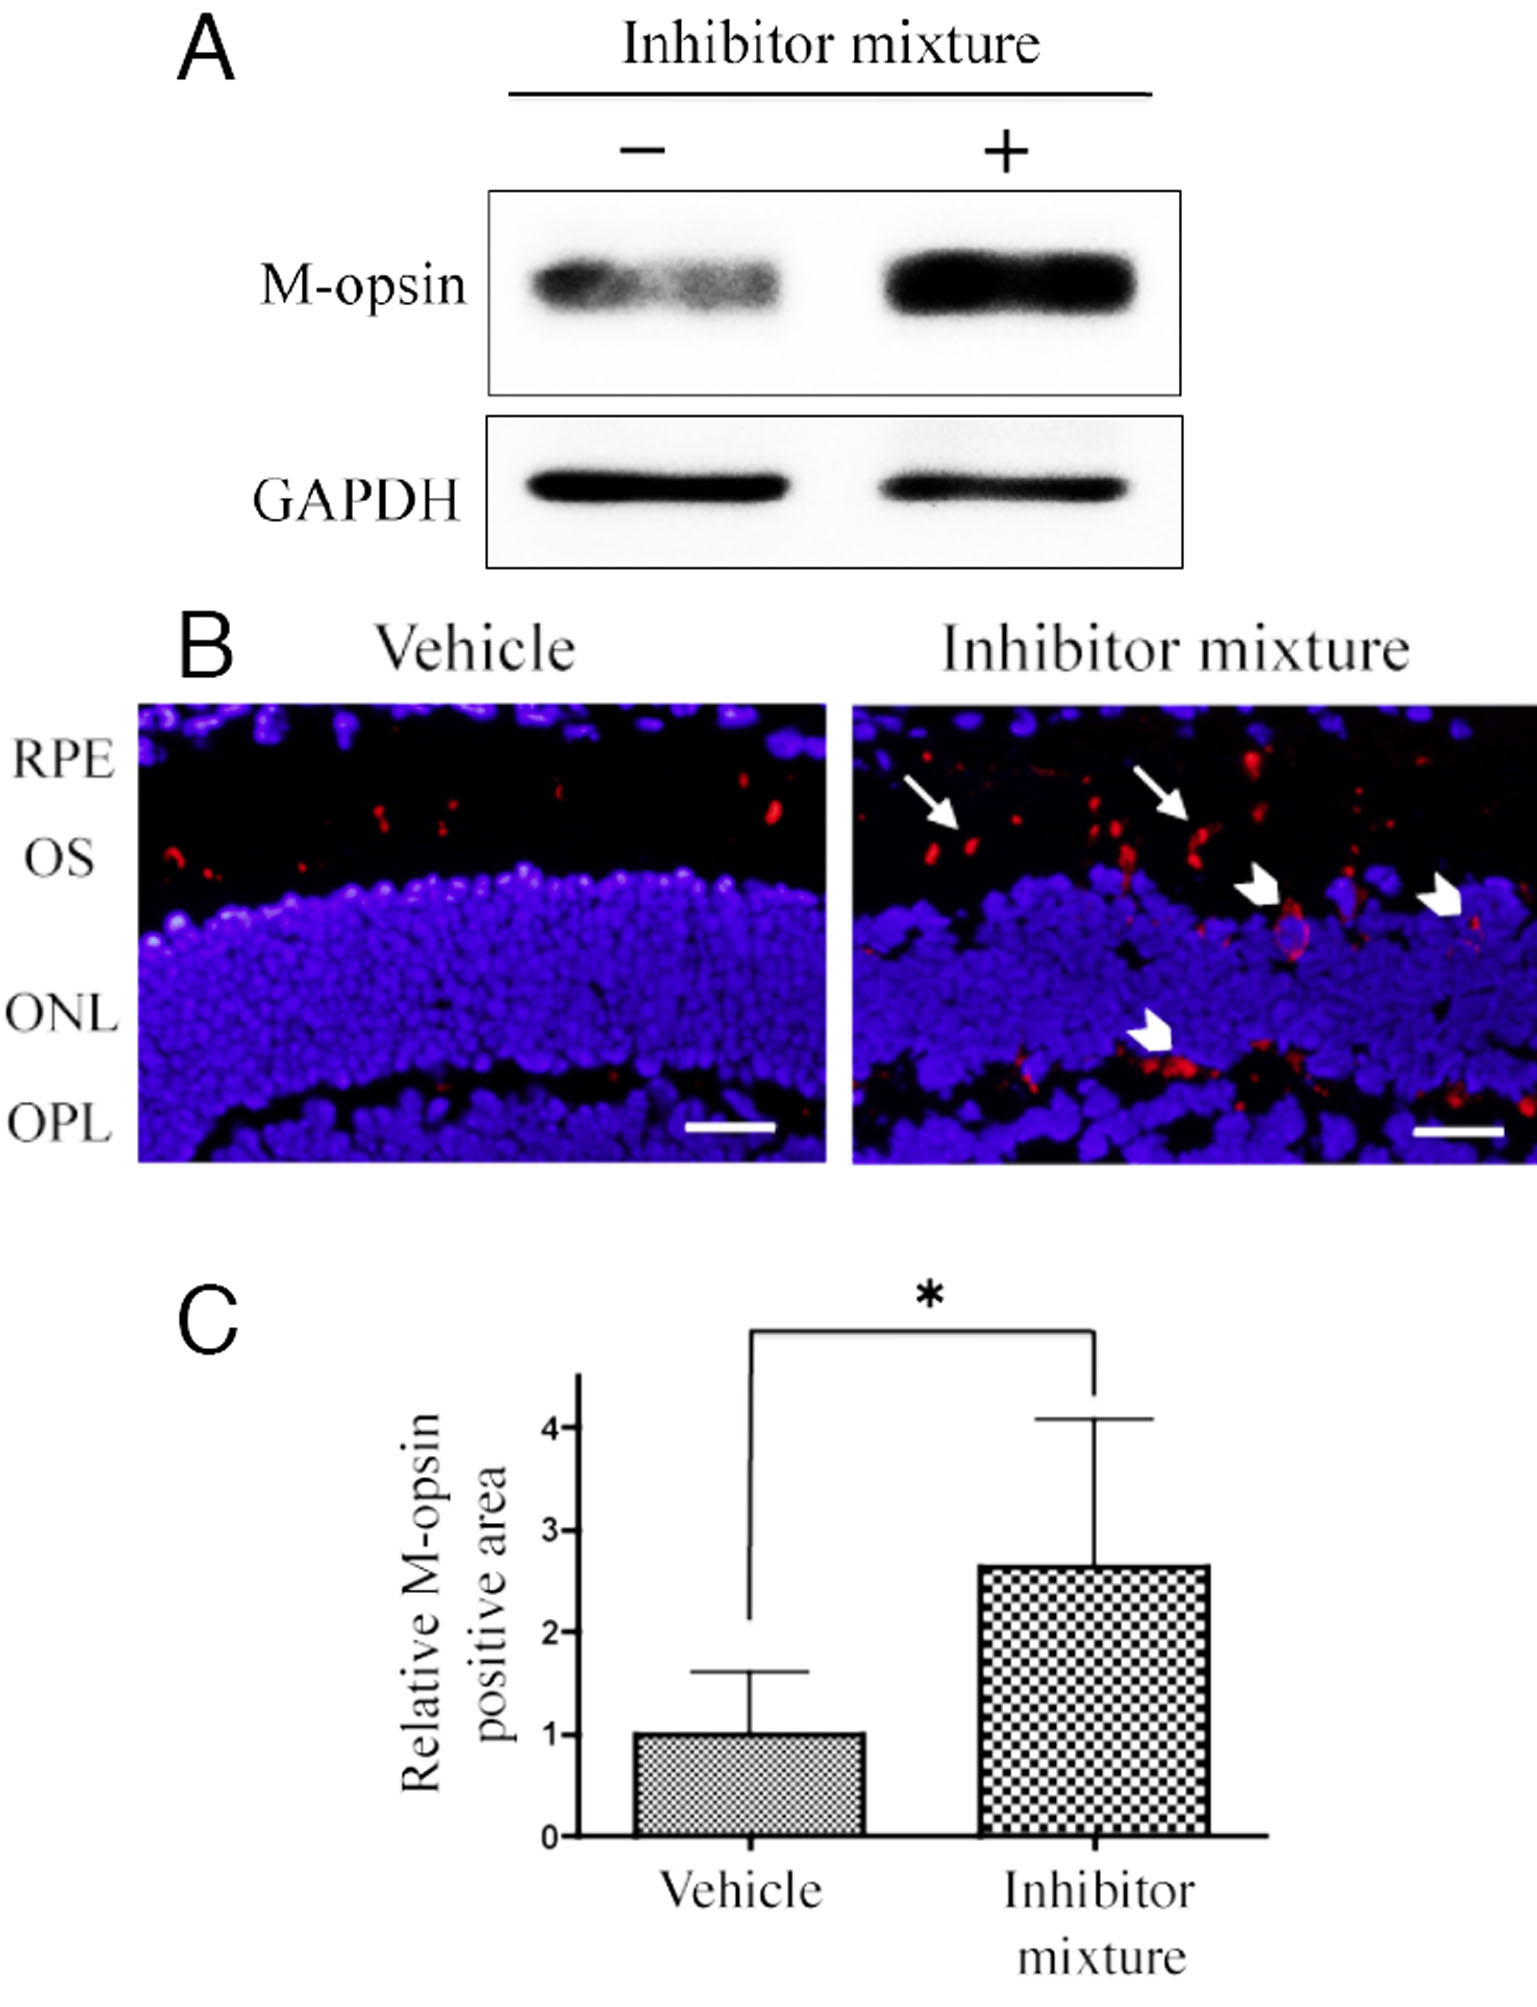
 Figure 3
of Sato, Mol Vis 2012; 18:1516-1525.
Figure 3
of Sato, Mol Vis 2012; 18:1516-1525.