Figure 7. Examination of 15 selected
gene expression profiles using polymerase chain reaction (PCR)
shows significant changes with treatment and time. Progenitor
markers nestin (A), Sox2 (B), Vimentin (C),
Ki-67 (D), Krüppel-like factor 4 (Klf4; J),
c-myc (K), and C-X-C chemokine receptor type 4 (CXCR4; L)
are profiled across time for each treatment. Mature neural
markers β3-tubulin (E) and Map2 (F) as well as
mature glial markers glial fibrillary acidic protein (GFAP; G),
myelin basic protein (MBP; H), and Claudin 11 (I)
are profiled as well. Changes to gene expression relating to the
Jak-STAT signaling pathway, Janus kinase 1 (Jak1; M),
signal transducer and activator of transcription 3 (STAT1; N)
and signal transducer and activator of transcription 3 (STAT3; O),
are also shown. Fold changes for the 15 gene profiles were
normalized to standard medium (SM) day 0. Data from treatment
day 1 are shown as red bars, day 3 as green bars, and day 5 as
blue bars. Both fetal bovine serum (FBS) and ciliary
neurotrophic factor (CNTF) treated groups are compared to SM,
respective to time point, and then significance was established
using the Student’s t-test. Error bars represent
standard error of the mean (SEM). *=p<0.05. β-Actin was used
as the endogenous control.
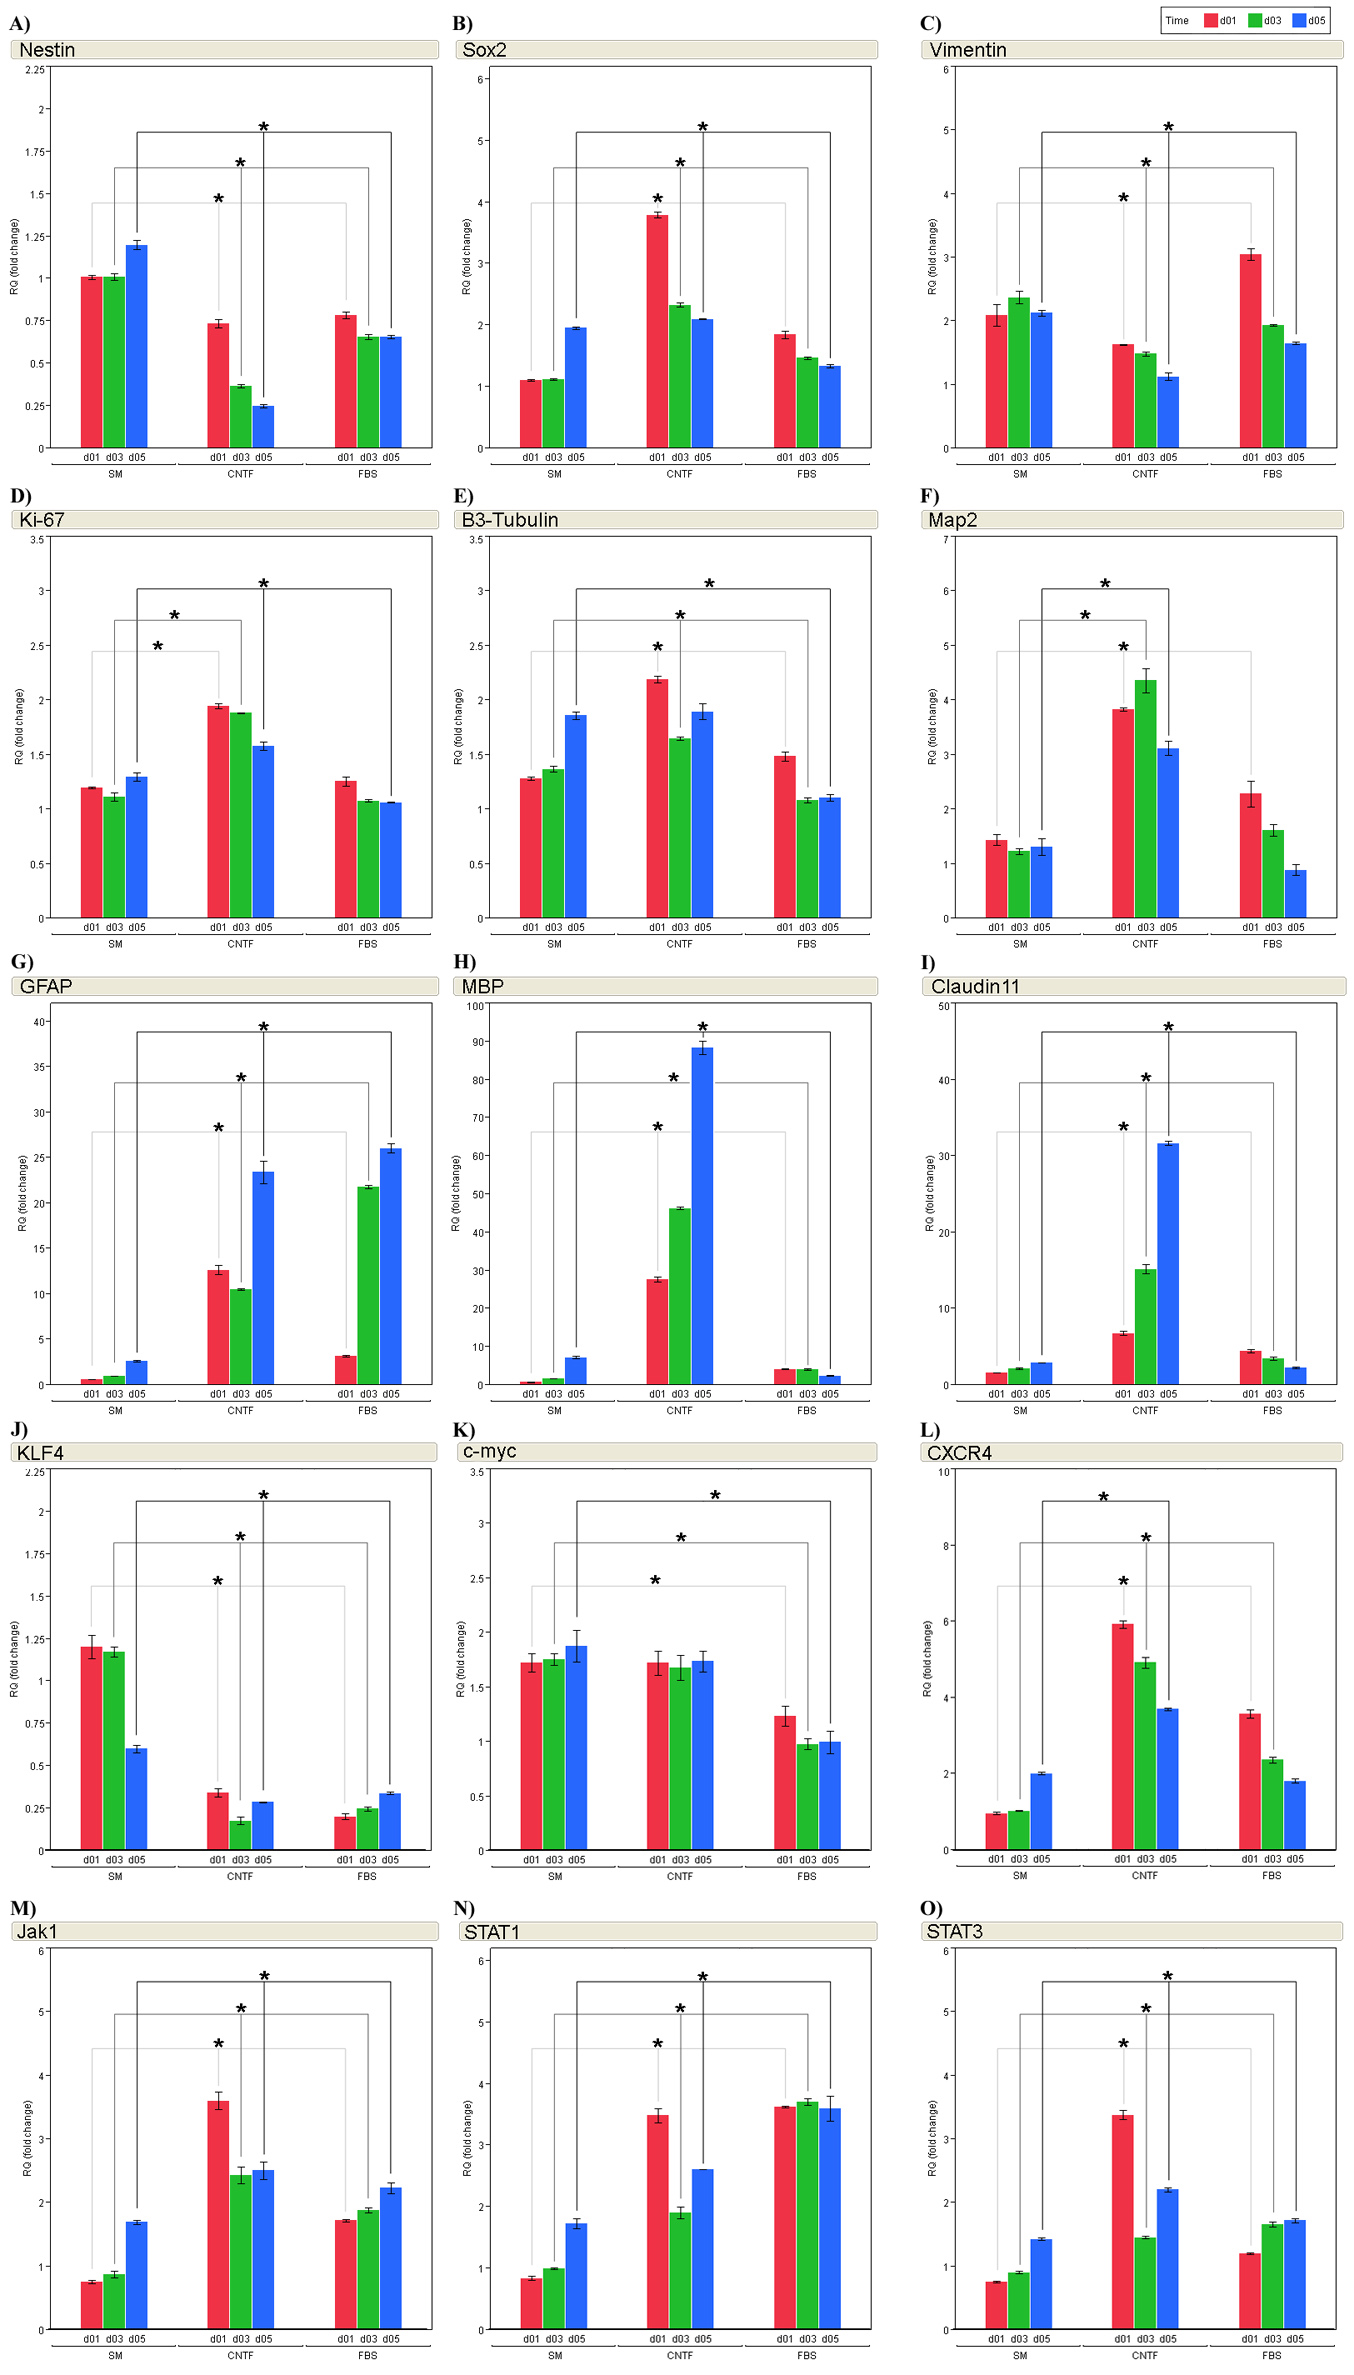
 Figure 7
of Yang, Mol Vis 2012; 18:1484-1504.
Figure 7
of Yang, Mol Vis 2012; 18:1484-1504.