Figure 6. Genes were examined during
the time course of treatment using real-time polymerase chain
reaction (PCR). Fifteen genes were profiled across five days
following treatment with either standard medium (SM, A),
ciliary neurotrophic factor (CNTF; B), or fetal bovine
serum (FBS; C). Fold changes in expression level were
calculated with RQ using the ΔΔCt method, normalized to SM day
0. Samples were run in triplicate and both CNTF and FBS
conditions were compared to the respective SM data for days 1, 3
and 5, with significance established using the Student’s t-test.
Error bars represent standard error of the mean (SEM).
*=p<0.05.
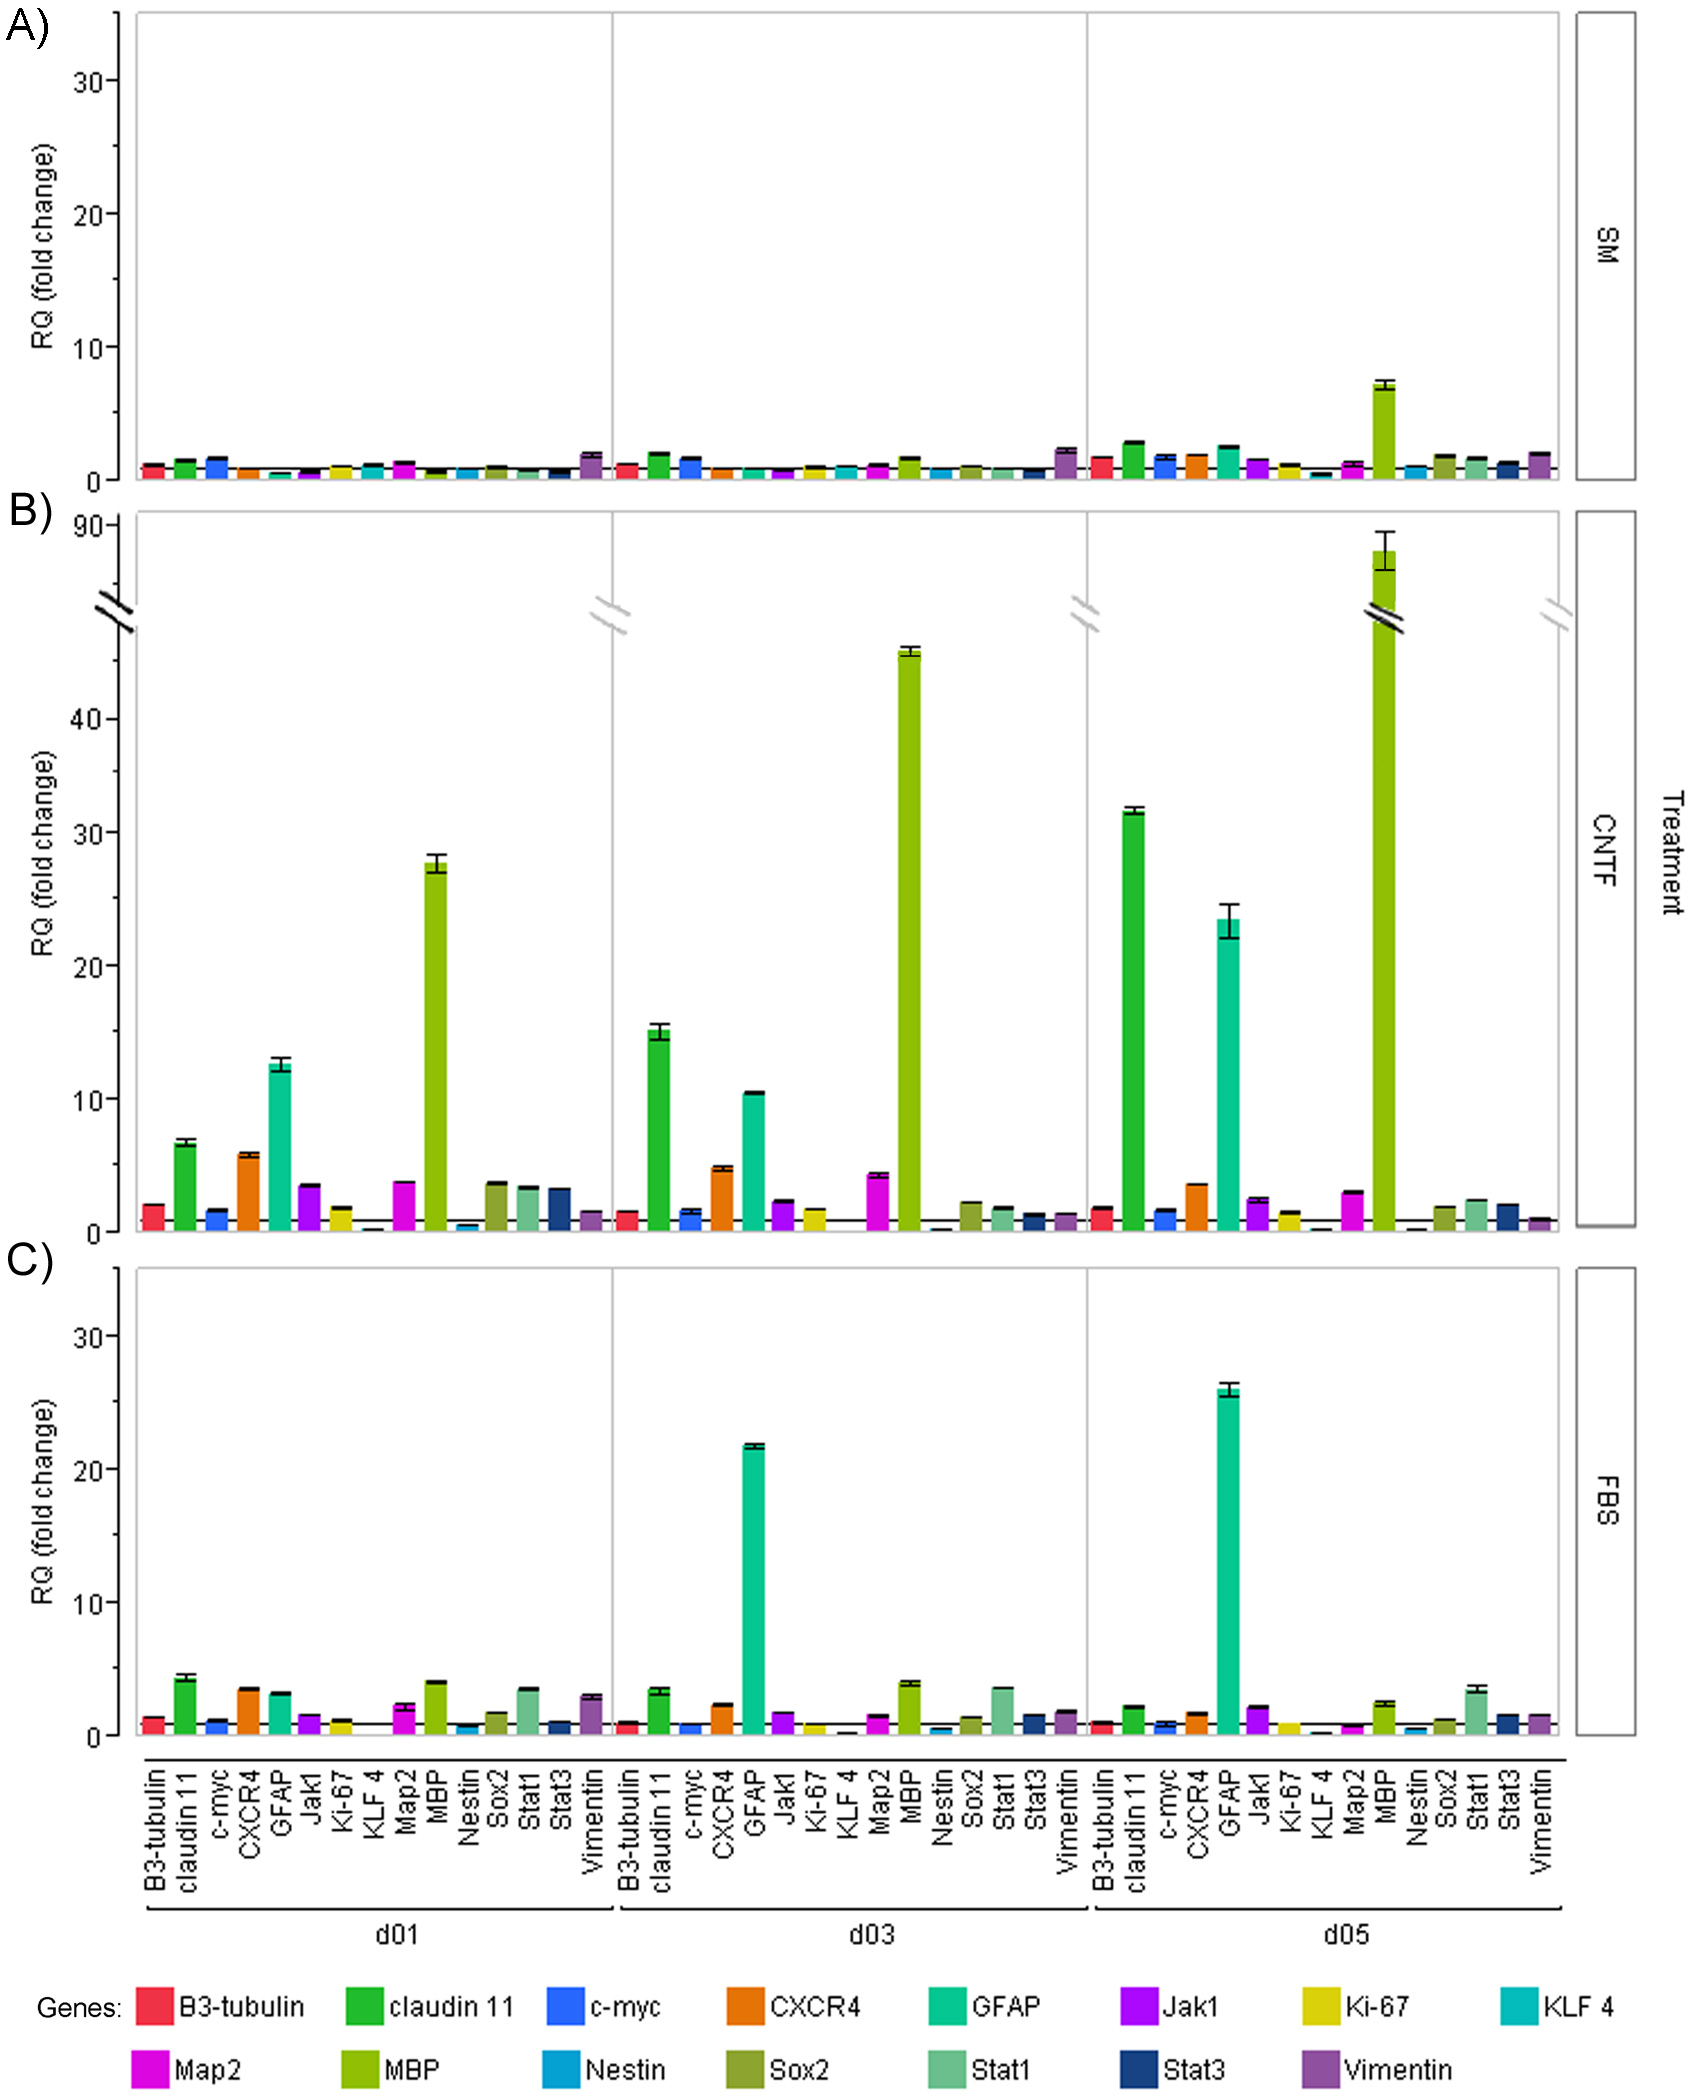
 Figure 6
of Yang, Mol Vis 2012; 18:1484-1504.
Figure 6
of Yang, Mol Vis 2012; 18:1484-1504.