Figure 5. Expression patterns of
selected genes were confirmed using quantitative real-time
polymerase chain reaction (PCR). Confirmation of selected
immature and lineage-related genes was undertaken using
quantitative real-time PCR and displayed as a global view heat
map across treatment conditions and time points in culture, the
latter indicated along the abscissa. As indicated by the group
labels, all porcine neural progenitor cultures were originally
derived from brain tissue at embryonic day 45 (E45-pBPC).
Untreated controls (standard medium [SM]) have titles in green
text, ciliary neurotrophic factor (CNTF) treatment in red, and
fetal bovine serum (FBS) in blue. The results were further
subjected to cluster analysis employing Pearson’s correlation
coefficient as a distance measure, as indicated by dendrograms
at top and left. For the heat map scale (right), black is set as
the median of all ΔCT values (23) obtained in the study, while
increasing intensity of red represents higher gene expression
levels and increasing green shows lower levels.
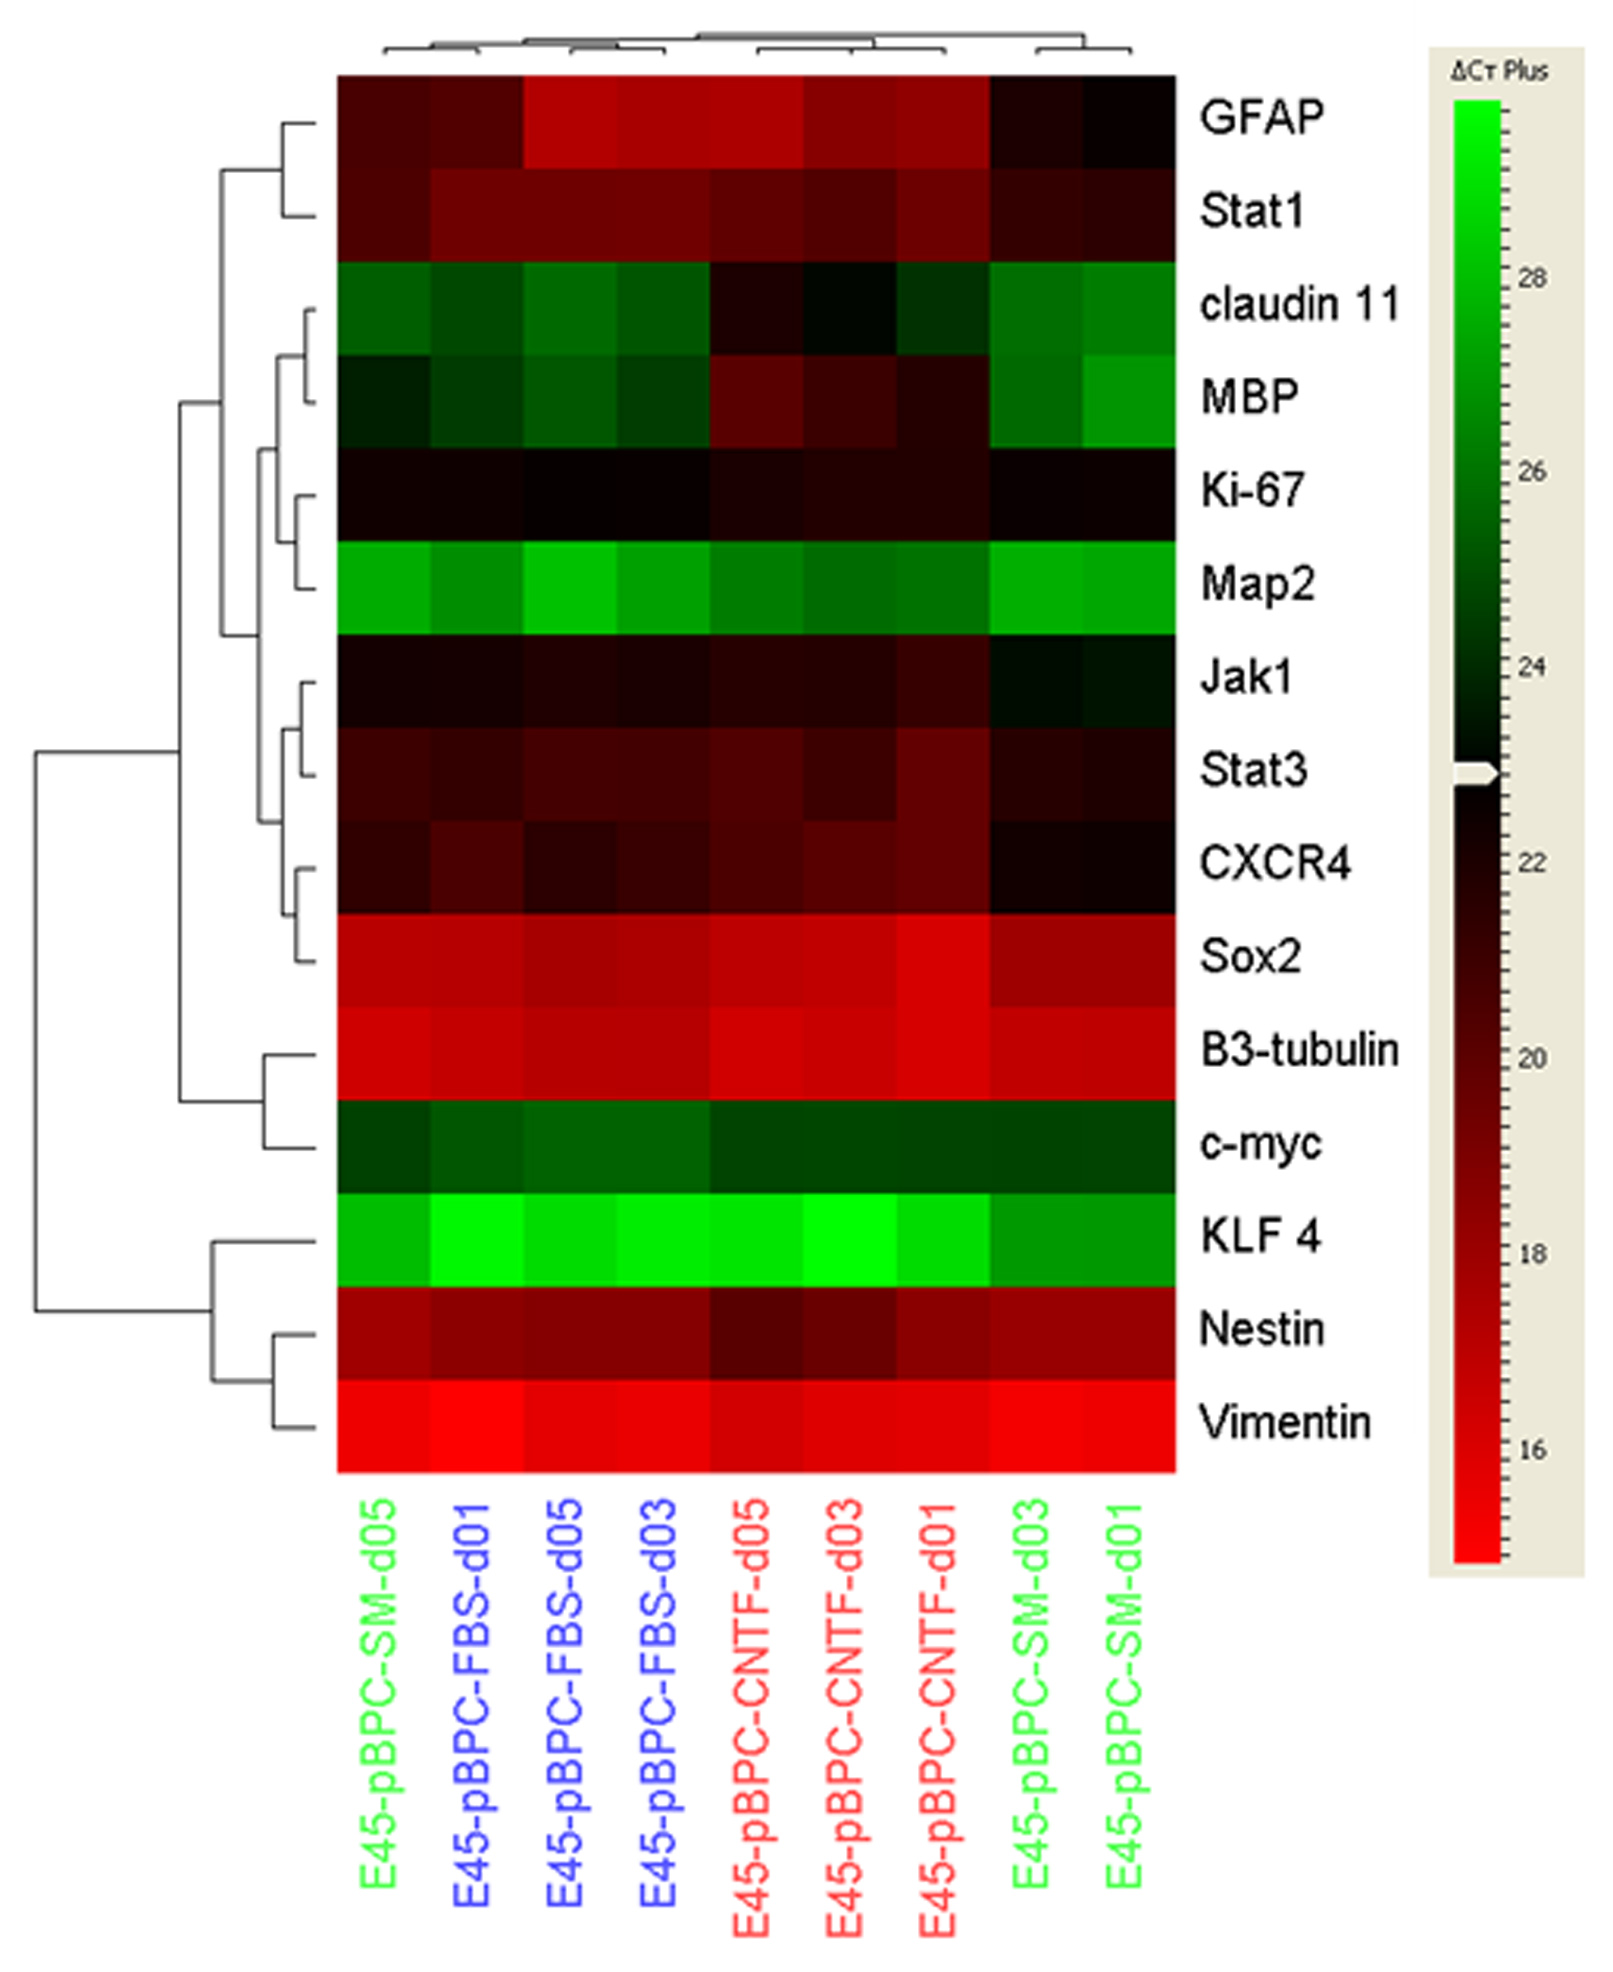
 Figure 5
of Yang, Mol Vis 2012; 18:1484-1504.
Figure 5
of Yang, Mol Vis 2012; 18:1484-1504.