Figure 2. Treatment conditions can be
distinguished based on changes in global gene expression using
principal component analysis (PCA). A: Principal
components were calculated for each the three treatments
(red=ciliary neurotrophic factor [CNTF), green=fetal bovine
serum [FBS], blue=standard medium [SM]). Data from each of these
treatments shows considerable separation from the other two,
with CNTF and SM at the two extremes. B: A Venn Diagram
showing significant genes (|fold change|>2, false discovery
rate [FDR] α<0.05) unique to either CNTF or FBS treatments
(normalized to SM), as well as those genes significantly
expressed in both treatments. The top number in each piece is
the total gene count in that area, and the numbers below
indicate the number of those genes that are upregulated and
downregulated.
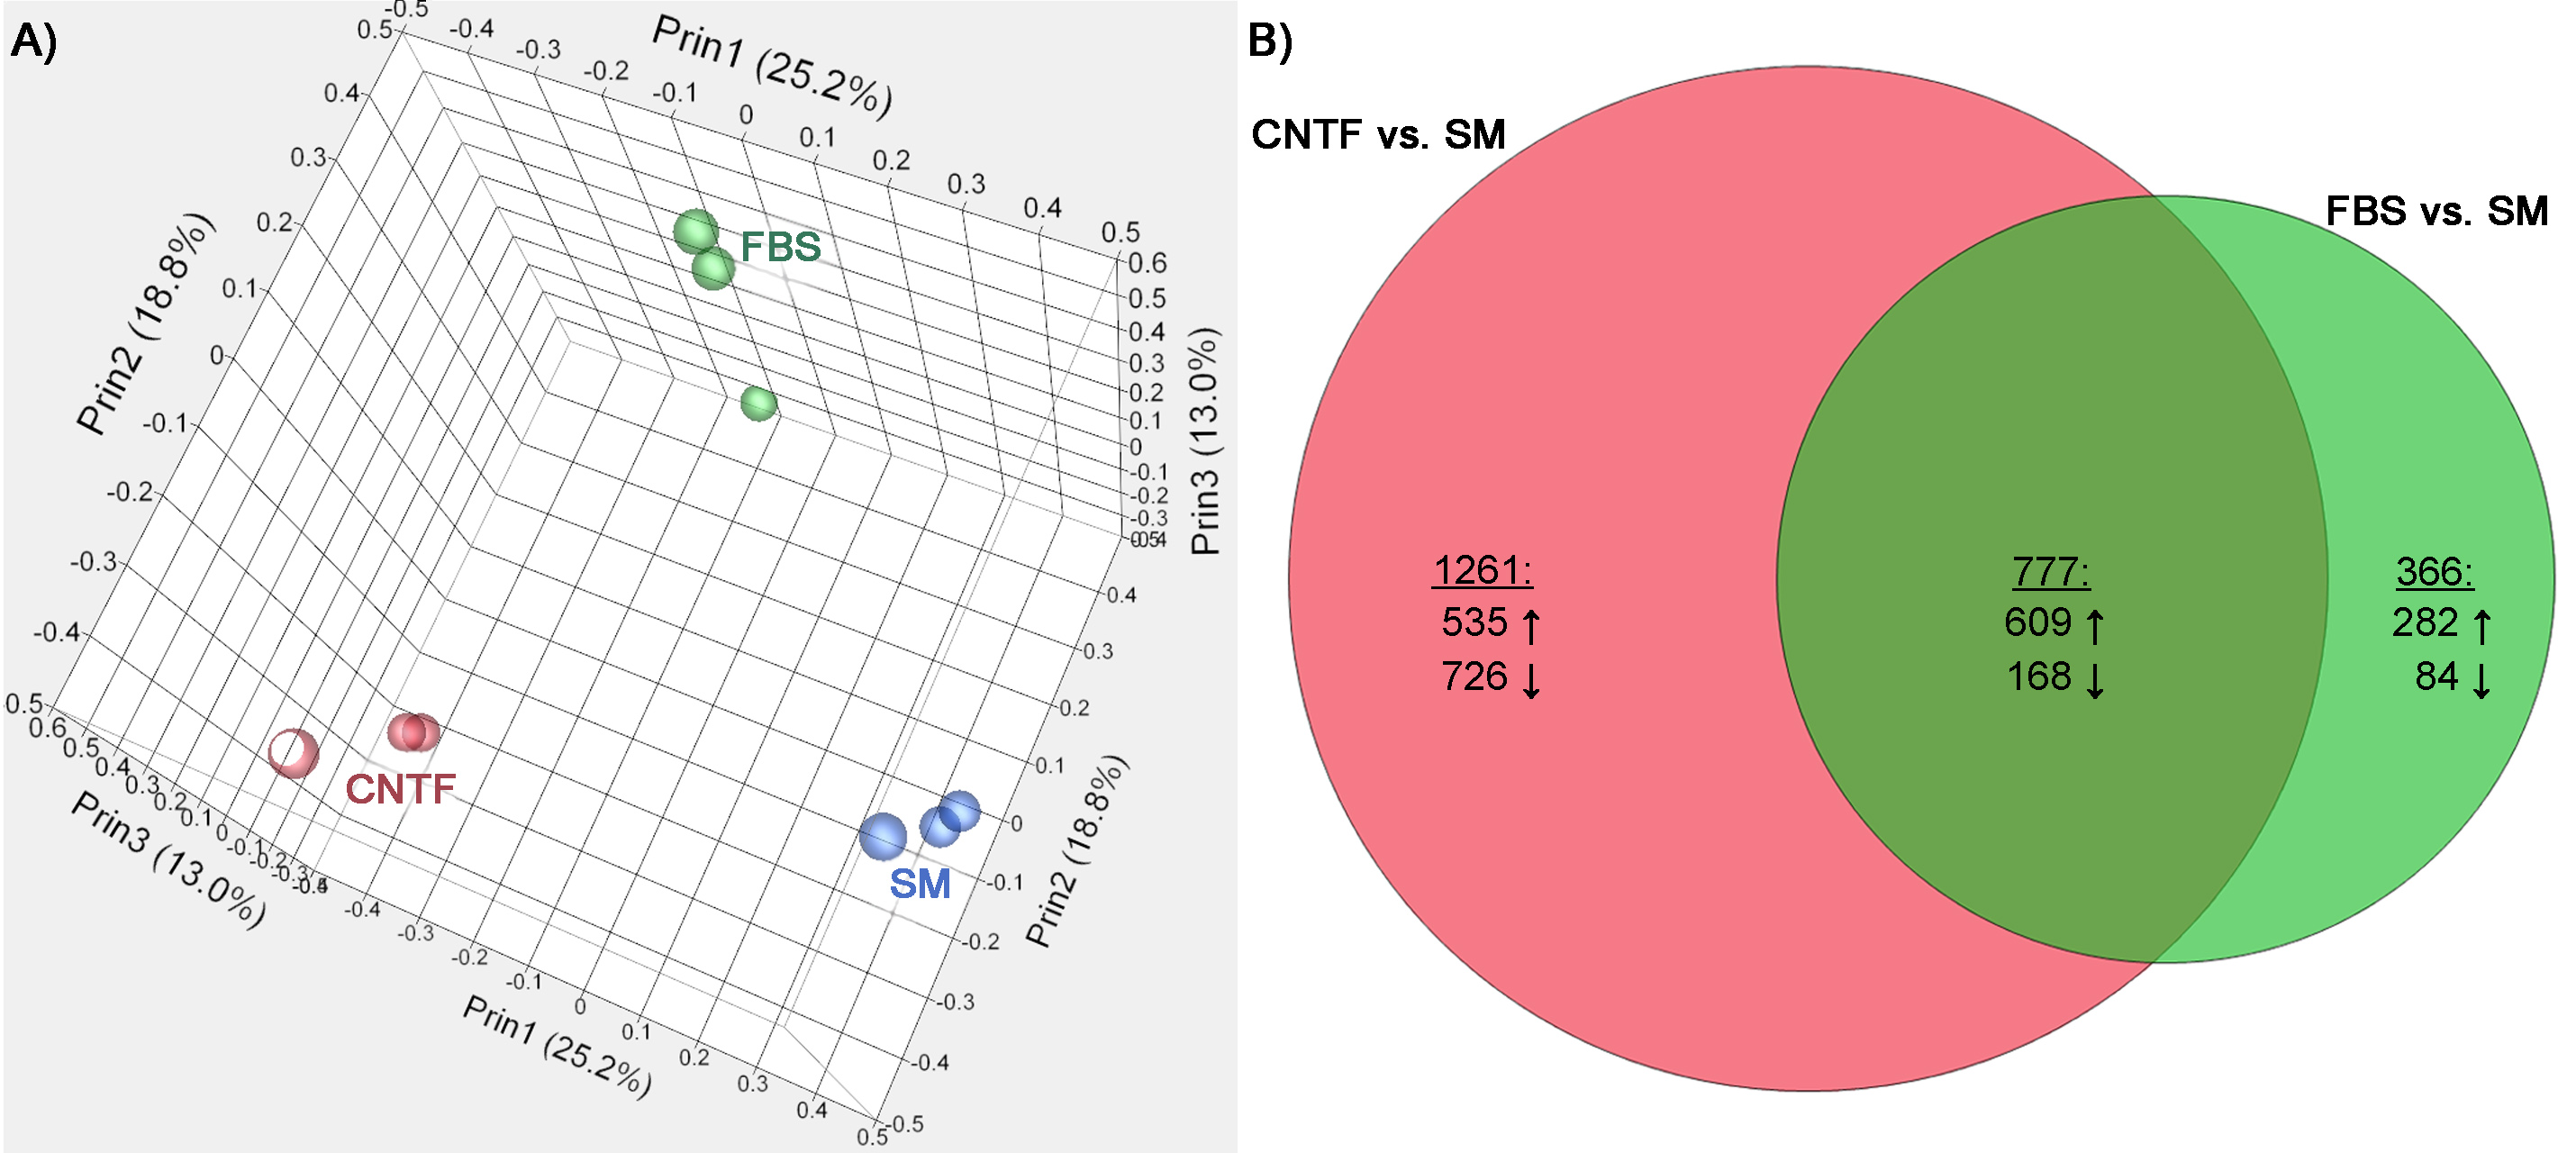
 Figure 2
of Yang, Mol Vis 2012; 18:1484-1504.
Figure 2
of Yang, Mol Vis 2012; 18:1484-1504.