Figure 3. Early stage hypertension
and diabetes suppress the Akt survival pathway. A:
Representative image for western blot analysis of retinal
phosphorylated-AKt (AKt) protein expression in early stage
spontaneous hypertensive rats (SHR) and diabetic spontaneous
hypertensive rats (SHR+D) compared to control wistar group (W).
B: Statistical analysis showing that activation of pAkt
was inhibited by 0.5 fold in the SHR group that was increased to
0.7 fold in the combined SHR+D group relative to the control W
group (n=3-4, *p<0.05).
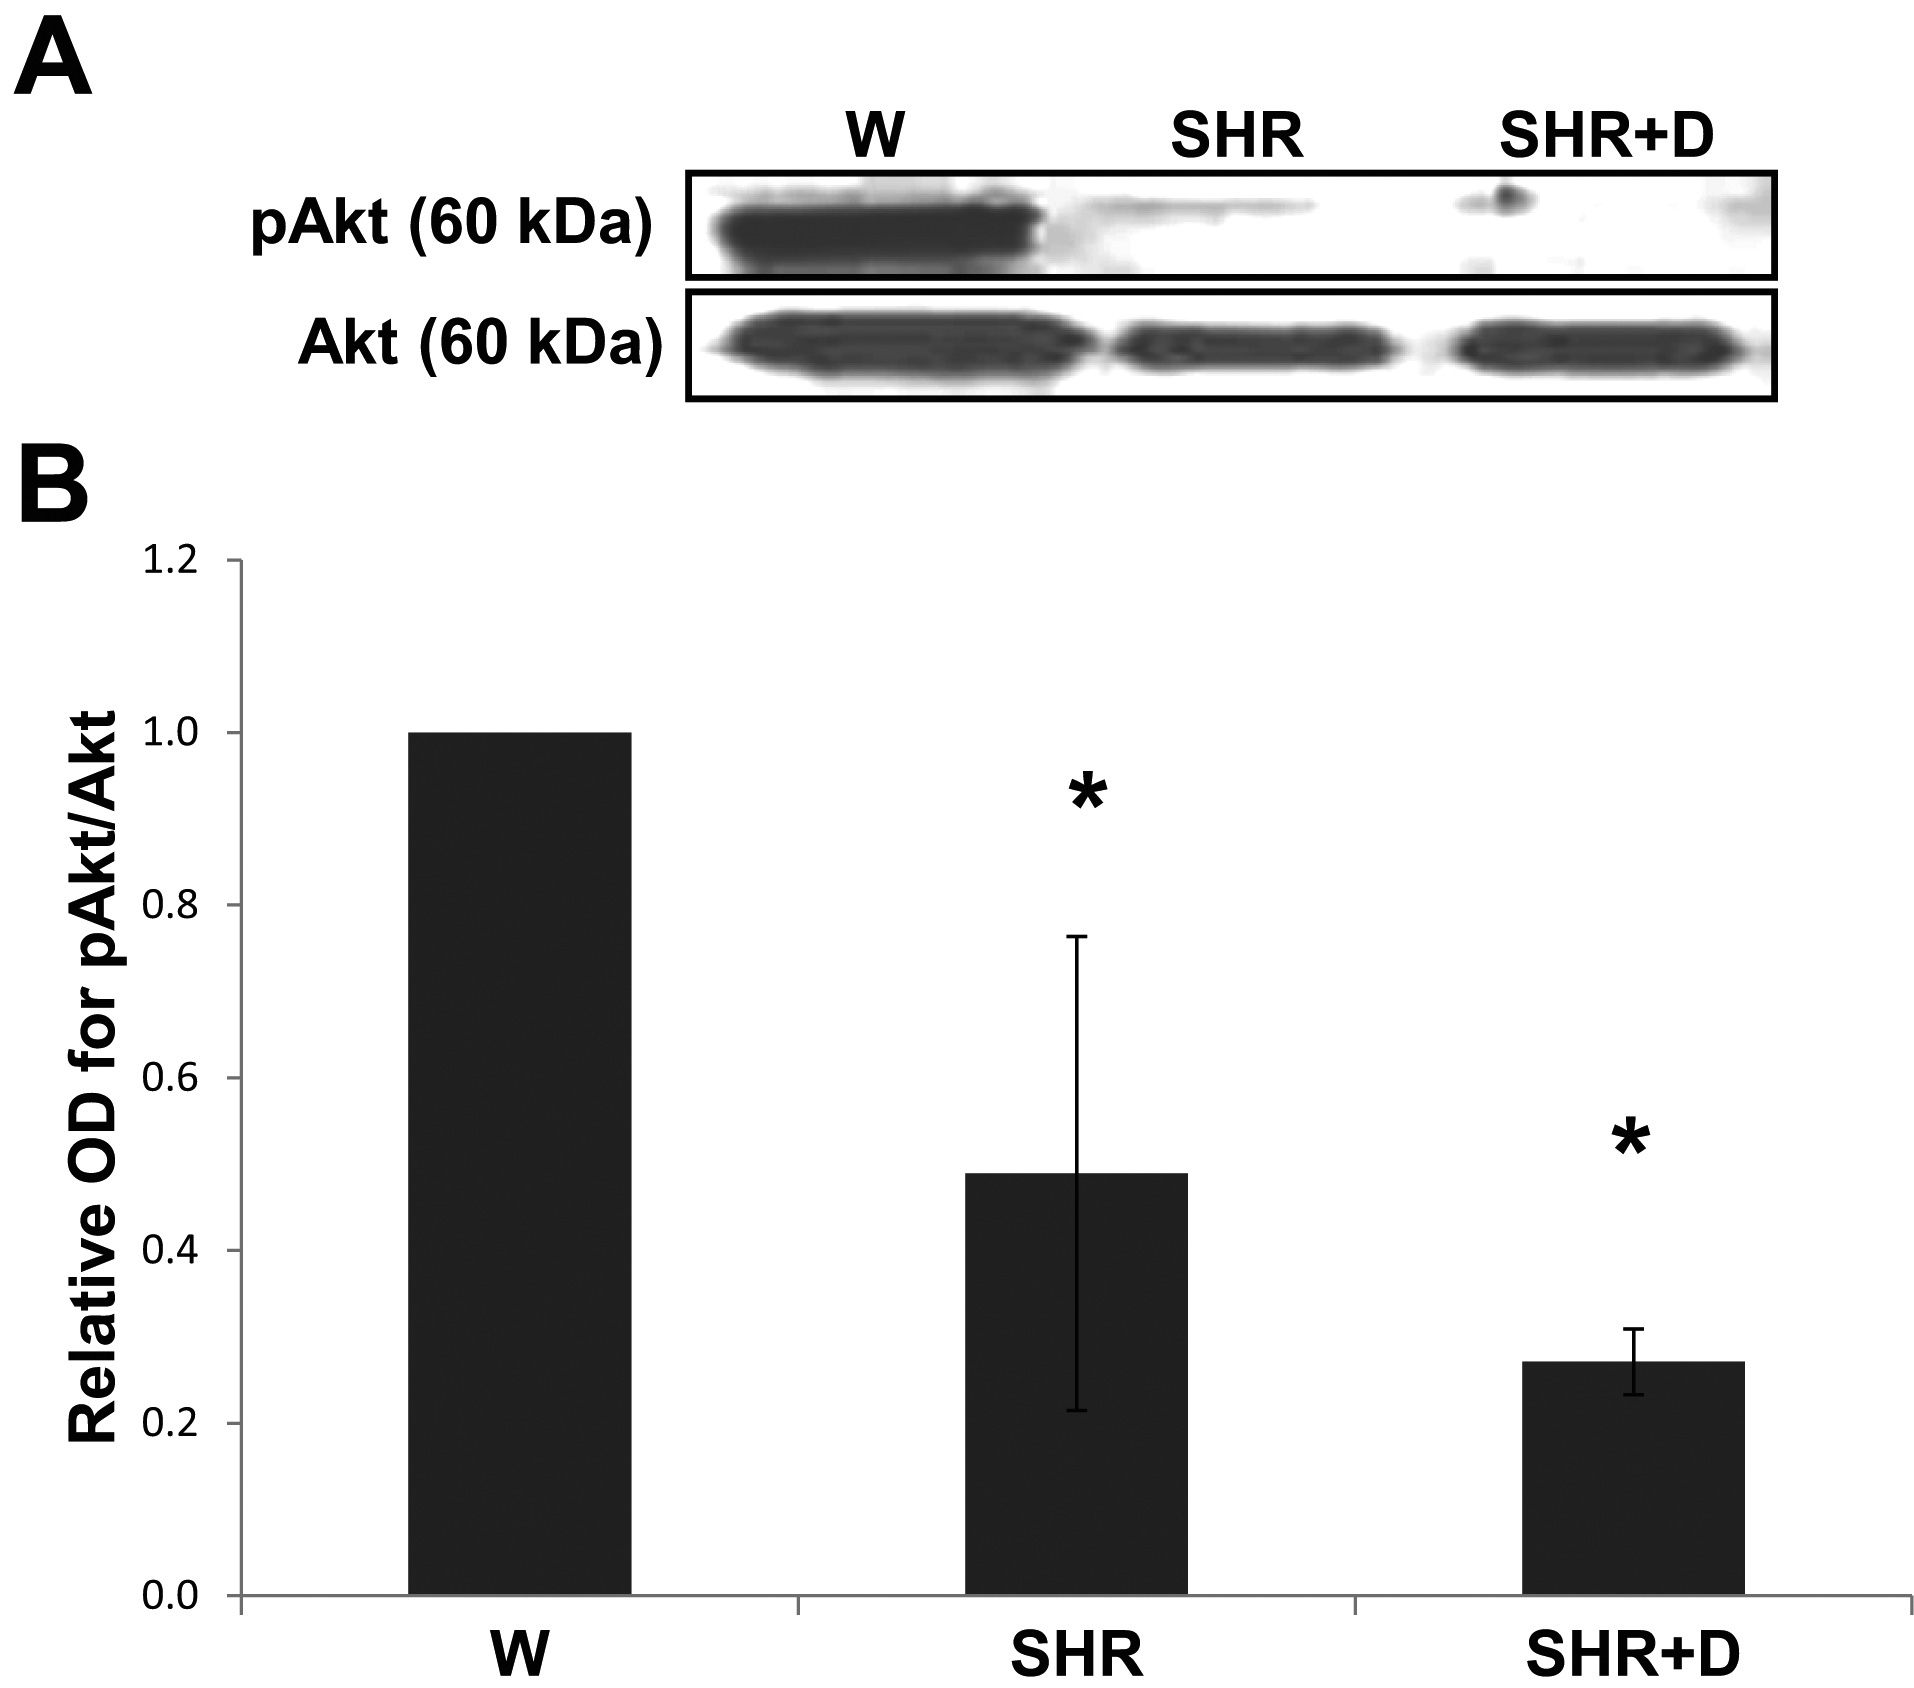
 Figure 3
of Mohamed, Mol Vis 2012; 18:1457-1466.
Figure 3
of Mohamed, Mol Vis 2012; 18:1457-1466.