Figure 5. Chromatogram obtained on a
Wave DHPLC system. Upperlane: PCR product of RAX exon 2 in a
normal individual (family A:IV:2) showing one single peak,
indicative of a unique product. Lowerlane: PCR product of the
same region in an heterozygous individual (family A, father of
IV:1). Three peaks corresponding to various heterodimers are
visible. These heterodimers are obtained from different
arrangements between wild-type and mutated DNA strands. y-axis:
intensity, x-axis: retention time. The difference in the shape
of the curves between normal and heterozygous individuals allows
for an easy estimate of the frequency of the mutation in normal
individuals.
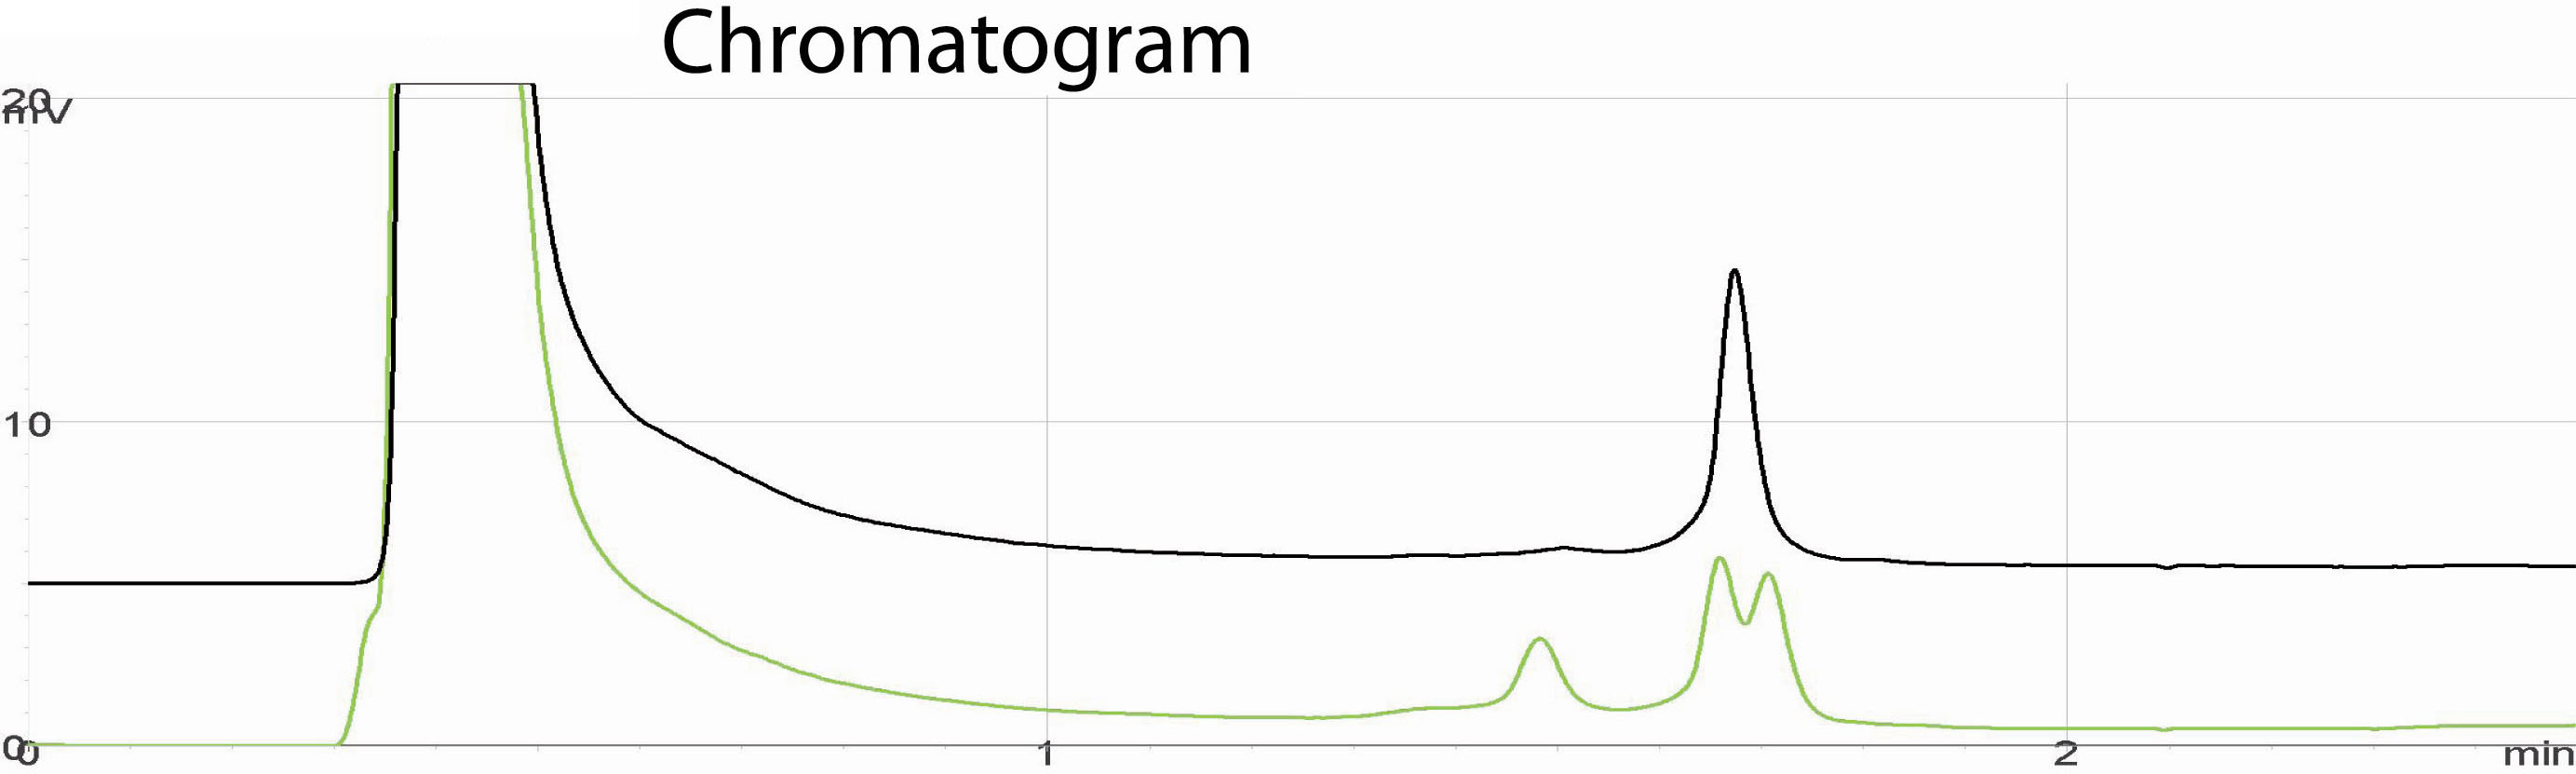
 Figure 5
of Abouzeid, Mol Vis 2012; 18:1449-1456.
Figure 5
of Abouzeid, Mol Vis 2012; 18:1449-1456.