Figure 5. Identification of network
with common gene interactions involved in postnatal sclera
development using IPA. IPA was used to generate several networks
using differentially expressed transcript cluster list from week
2 versus 1 (A), week 3 versus 2 (B), week 6 versus
3 (C), and week 8 versus 6 (D). The network from
each differentially expressed transcript cluster list with
common gene interactions (calculated by Fisher’s exact test;
p<0.05) was identified. Ppargc1a was the only common
gene that was involved in the networks generated from
differentially expressed transcript cluster list of week 2
versus 1, week 3 versus 2, week 6 versus 3, and week 8 versus 6,
respectively. Red color represents the upregulated genes and
green color represents the down-regulated genes from micro array
analysis. Intensity of the color indicates the gene expression
level.
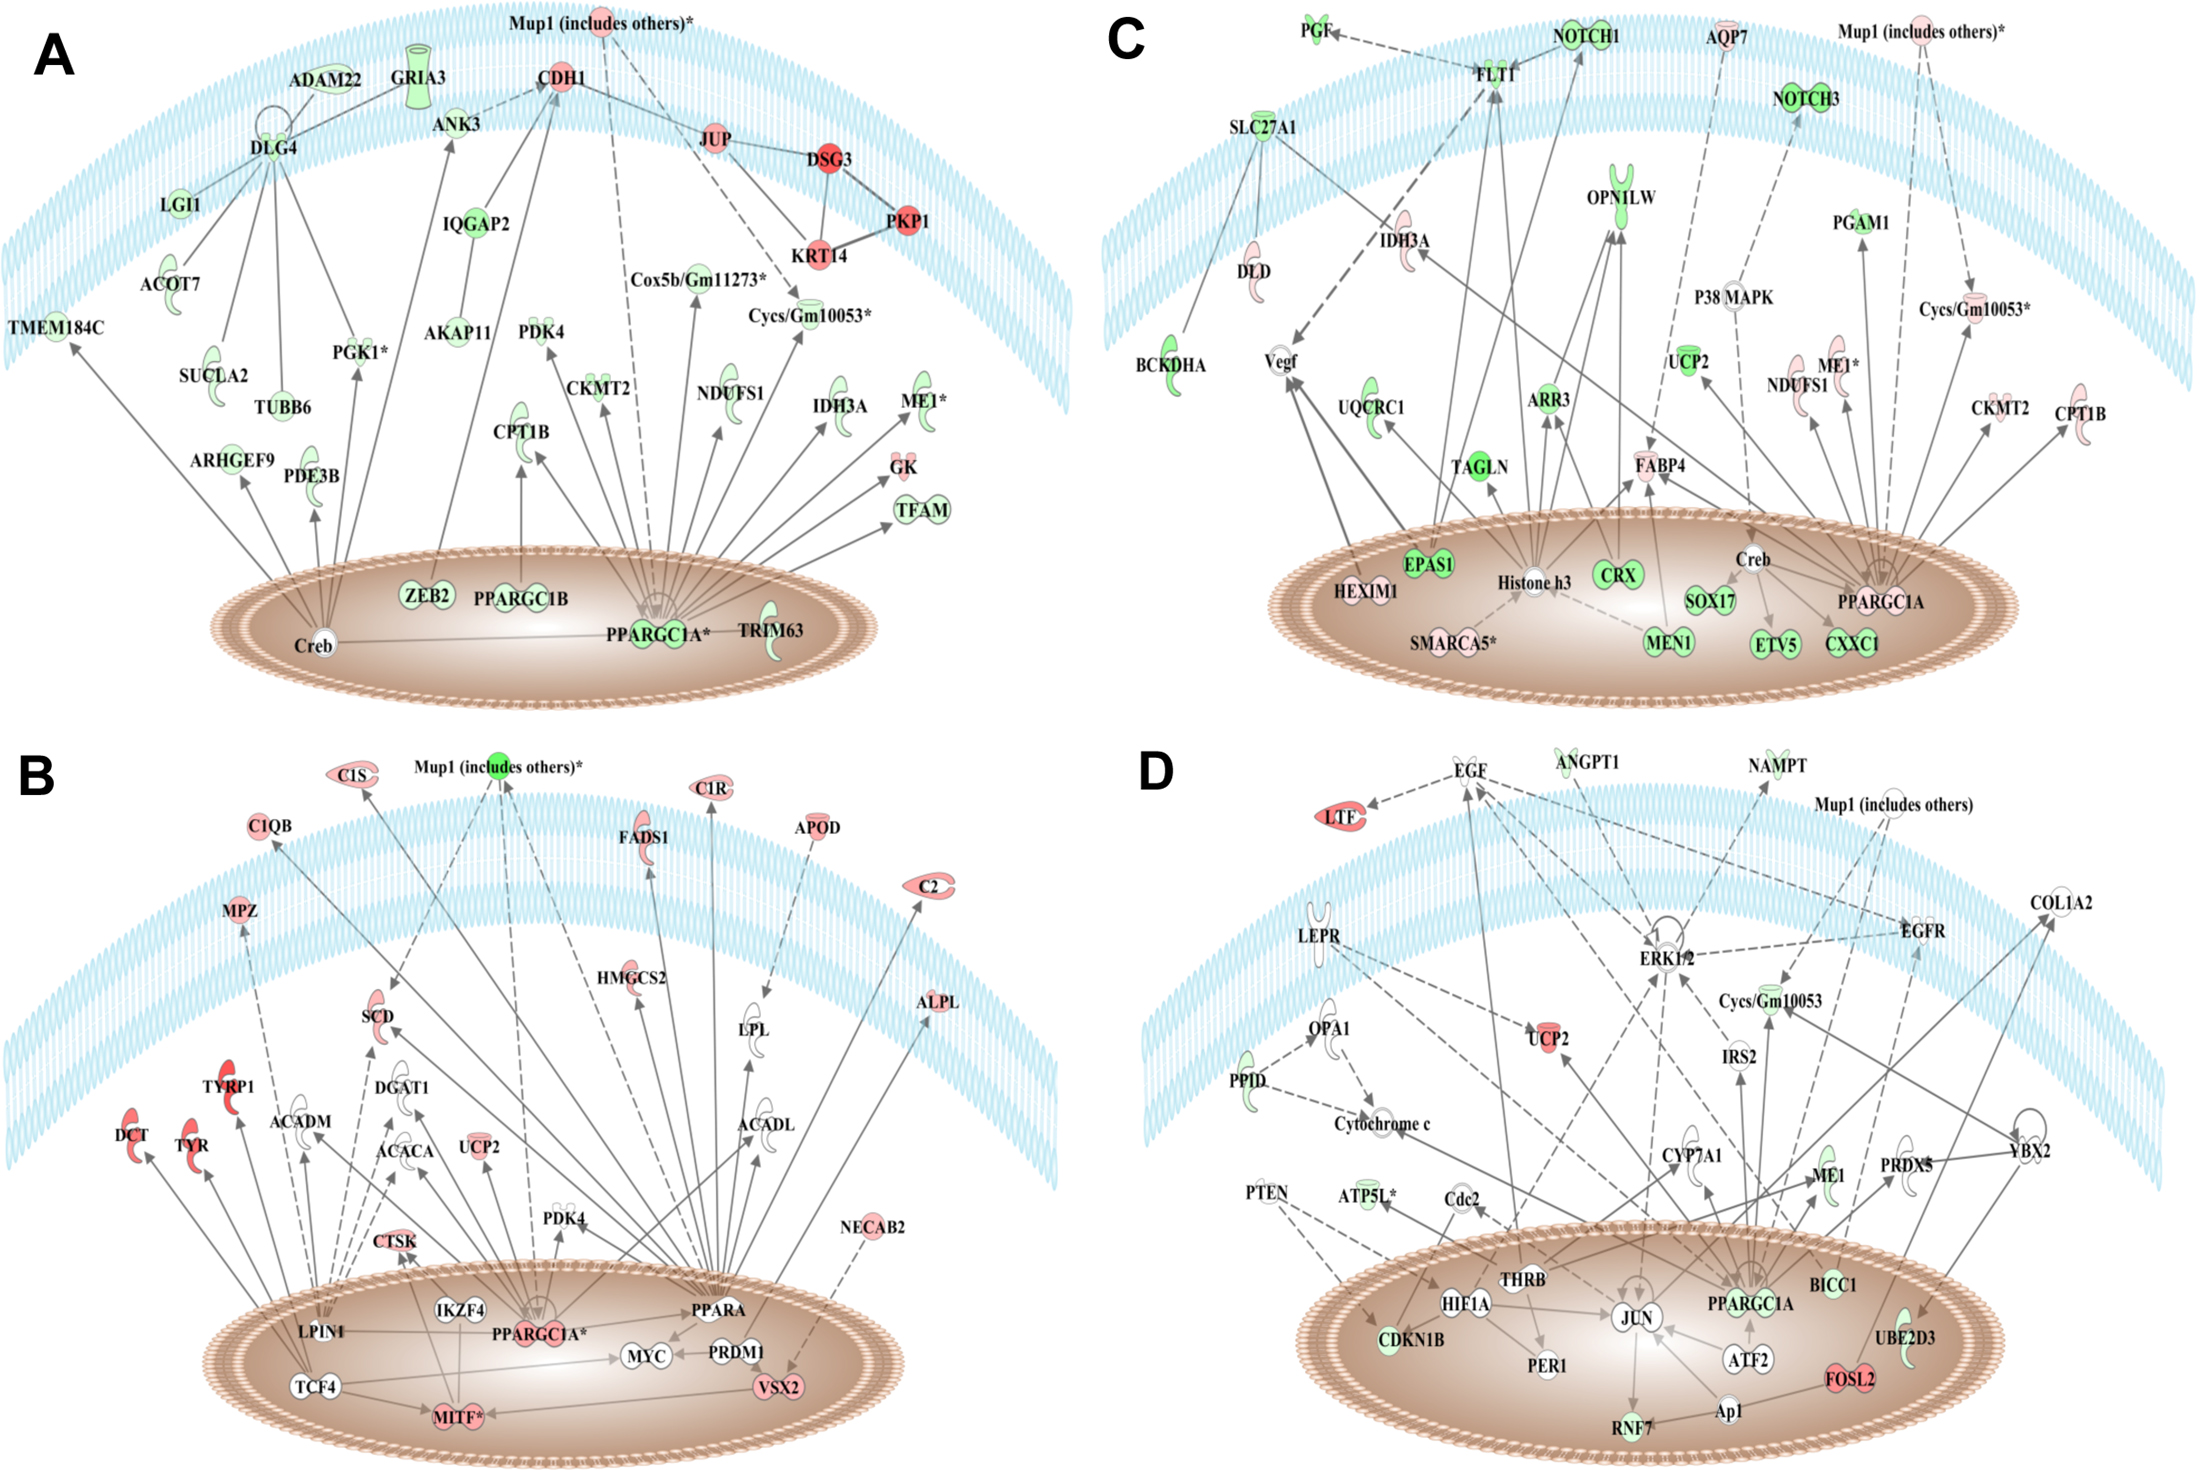
 Figure 5
of Lim, Mol Vis 2012; 18:1436-1448.
Figure 5
of Lim, Mol Vis 2012; 18:1436-1448.