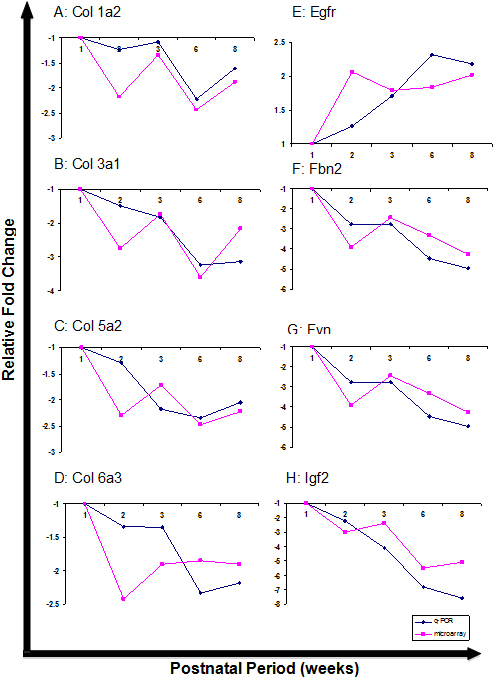
Figure 4. qPCR analysis of collagen genes, Egfr, Fbn2, Fyn, and Igf2. The gene expression profiles of Col-1a2, -3a1, -5a2, -6a3, and Egfr, Fbn2, Fyn, and Igf2 in week 1, 2, 3, 6, and 8 were compared the microarray data. It was demonstrated that the expression profiles of these genes
obtained from the microarray data showed a similar gene regulation direction, as compared to the expression profiles obtained
from qPCR.

 Figure 4 of
Lim, Mol Vis 2012; 18:1436-1448.
  Figure 4 of
Lim, Mol Vis 2012; 18:1436-1448.