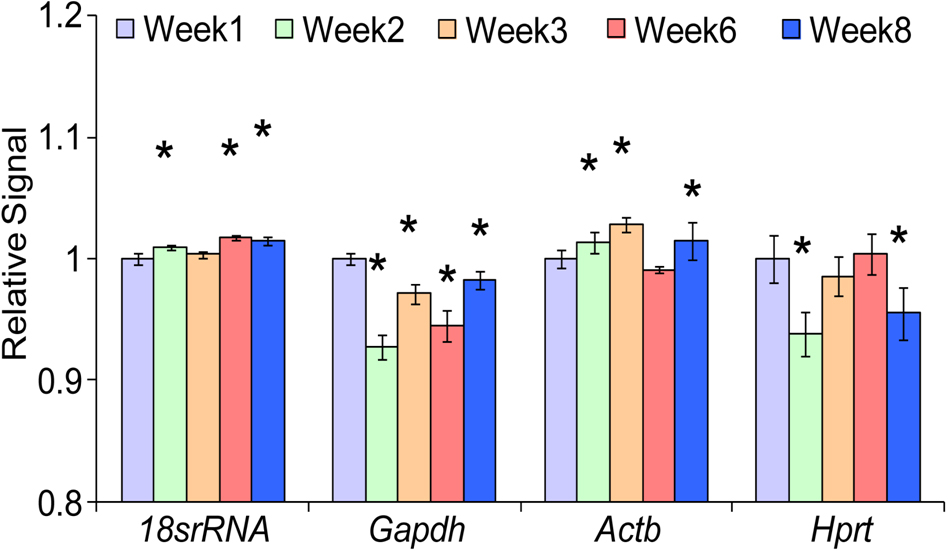
Figure 3. Gene expression of 4 housekeeping genes from microarray data. Mean relative signal (n=6) and standard deviation of 4 housekeeping
genes were calculated and plotted to compare their gene expression from week 1, 2, 3, 6, and 8. ANOVA analysis was performed
to compare the gene expression of different weeks against week 1 gene expression. * represents p<0.05. It was shown that there
were some significant differences in the gene expression of glyceraldehyde-3-phosphate dehydrogenase (Gapdh), beta actin (Actb), hypoxanthine guanine phosphoribosyl transferase (Hprt), and 18S rRNA(18S rRNA) when week 2, 3, 6, and 8 were compared with week 1.

 Figure 3 of
Lim, Mol Vis 2012; 18:1436-1448.
  Figure 3 of
Lim, Mol Vis 2012; 18:1436-1448.