Figure 2. GO analysis of sclera
postnatal development. GO analysis was used to identify that the
main biologic processes that were involved in scleral growth
from postnatal week 1 to 2 (A), week 2 to 3 (C),
week 3 to 6 (E), and week 6 to 8 (G),
respectively. Furthermore, forest plots were generated to
analyze the percentage of genes that were either upregulated or
down-regulated in each of the biologic processes that was
involved in scleral growth from postnatal week 1 to 2 (B),
week 2 to 3 (D), week 3 to 6 (F), and week 6 to 8
(H), respectively.
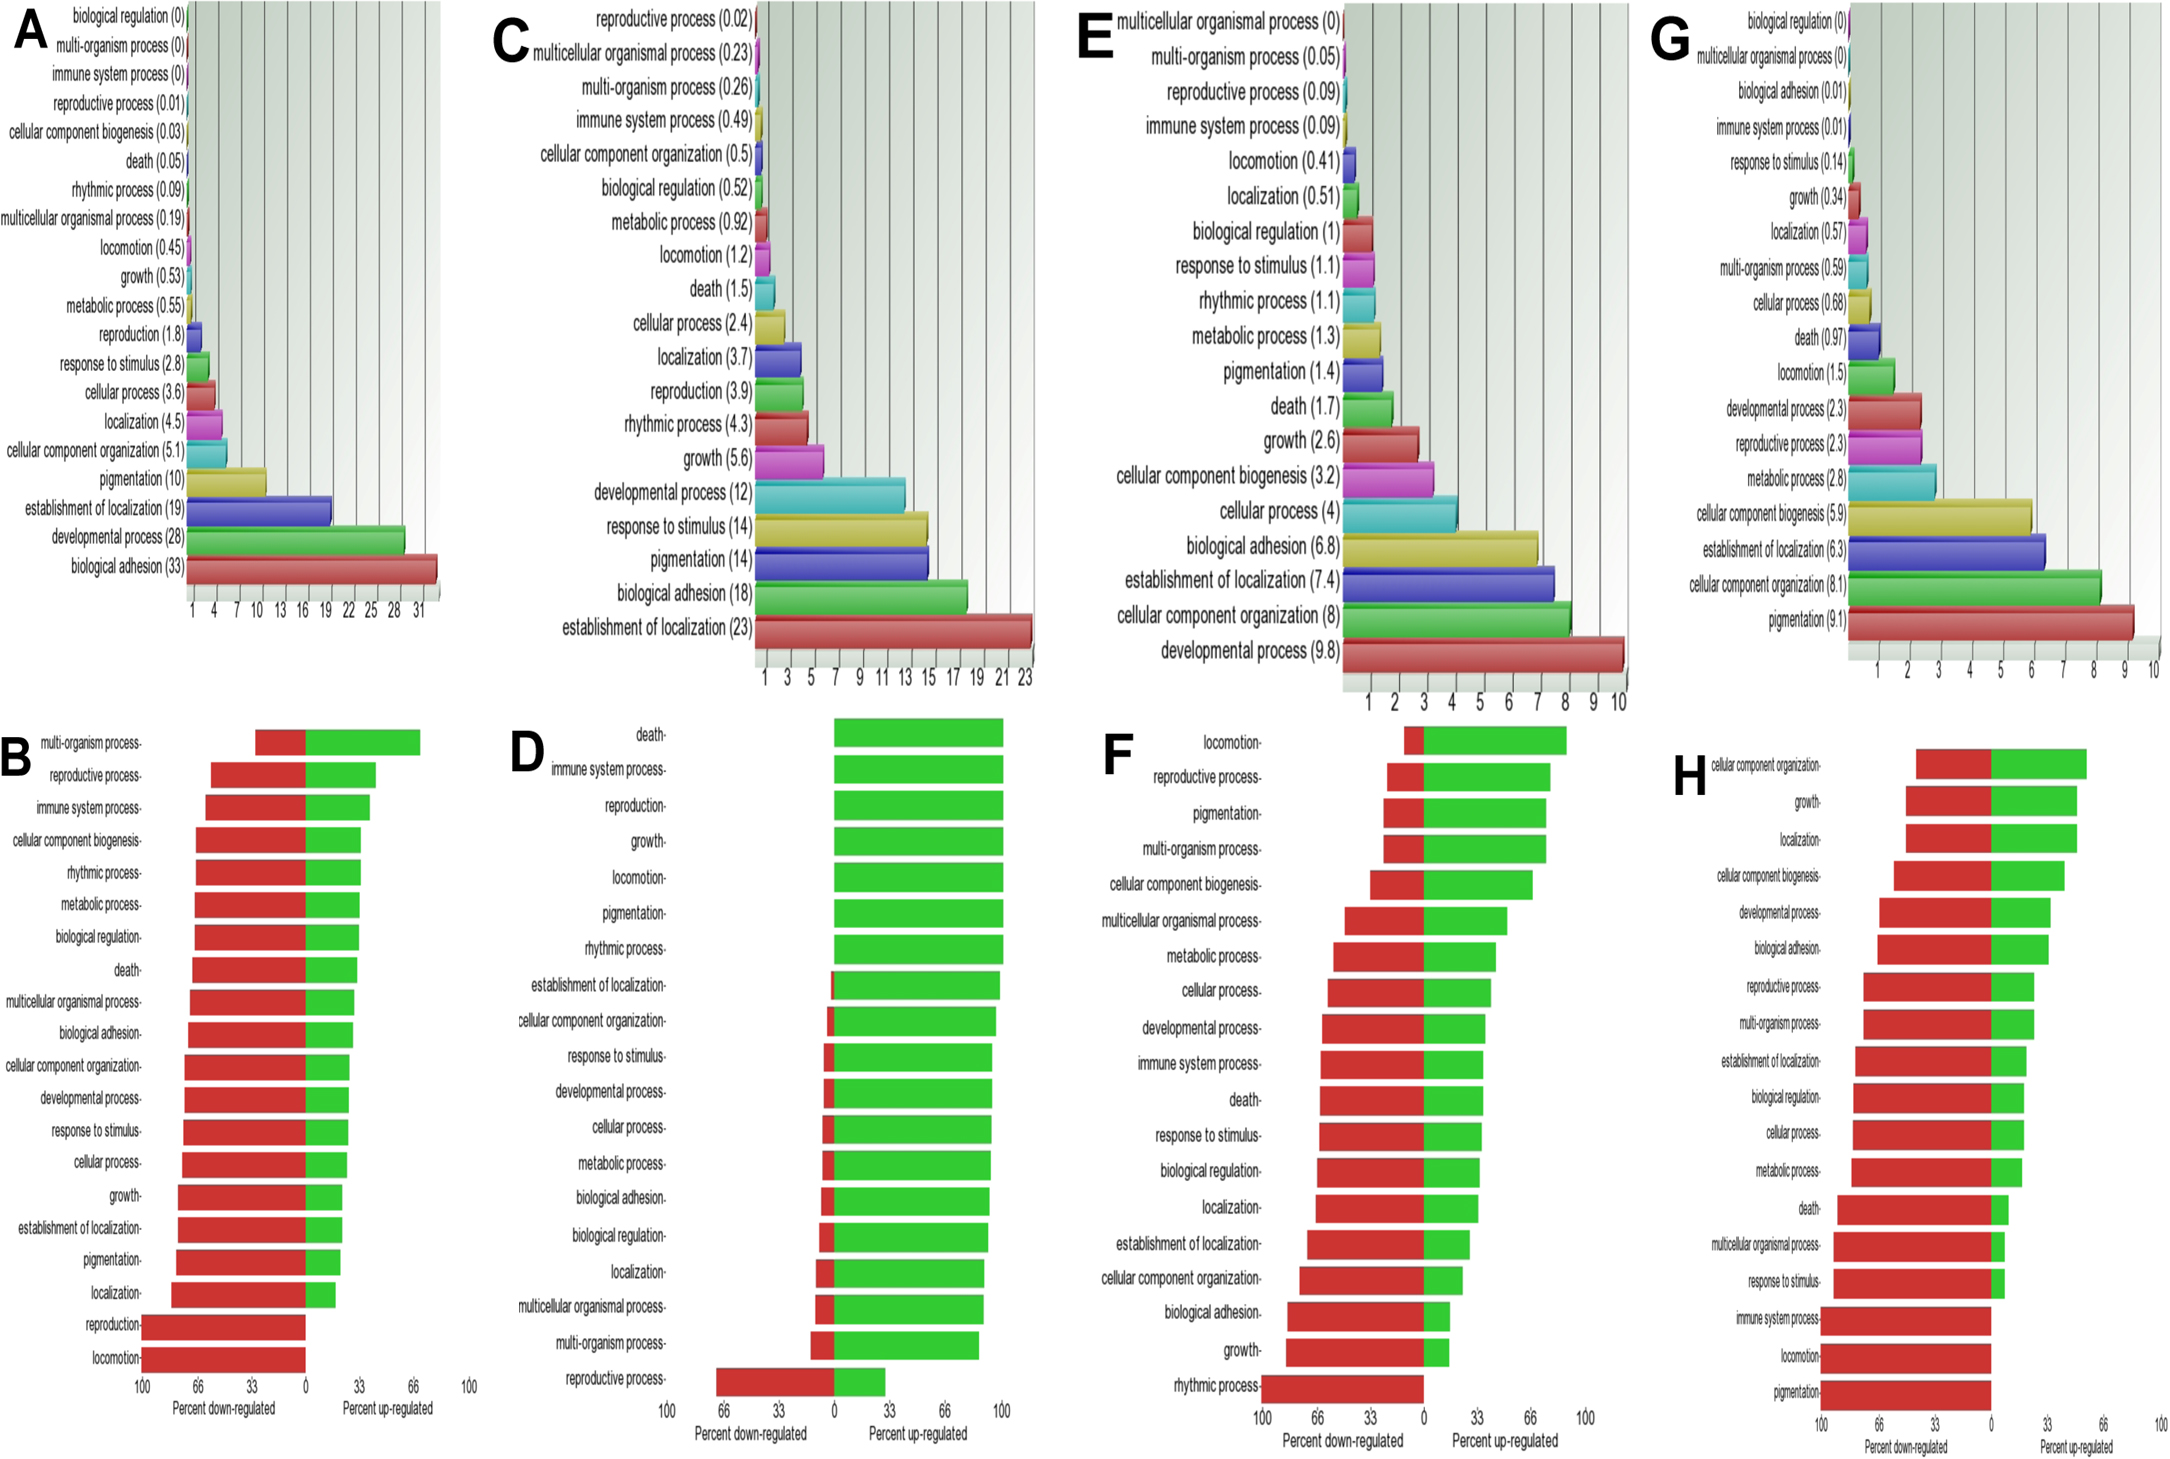
 Figure 2
of Lim, Mol Vis 2012; 18:1436-1448.
Figure 2
of Lim, Mol Vis 2012; 18:1436-1448.