Figure 5. Quantification of
Brn3a-labeled retinal ganglion cells in retinal flatmounts. A:
Compared to control groups, diabetic mice have significantly
decreased numbers of retinal ganglion cells (RGCs; n=10/group).
B: There is a similar result of percentage of RGCs
labeled with Brn3a. The percentage of RGCs for marker
combination was calculated in relation to the number of RGCs.
Data are expressed as means±standard deviation (SD; * indicates
p<0.05, ** indicates p<0.01, *** indicates p<0.001).
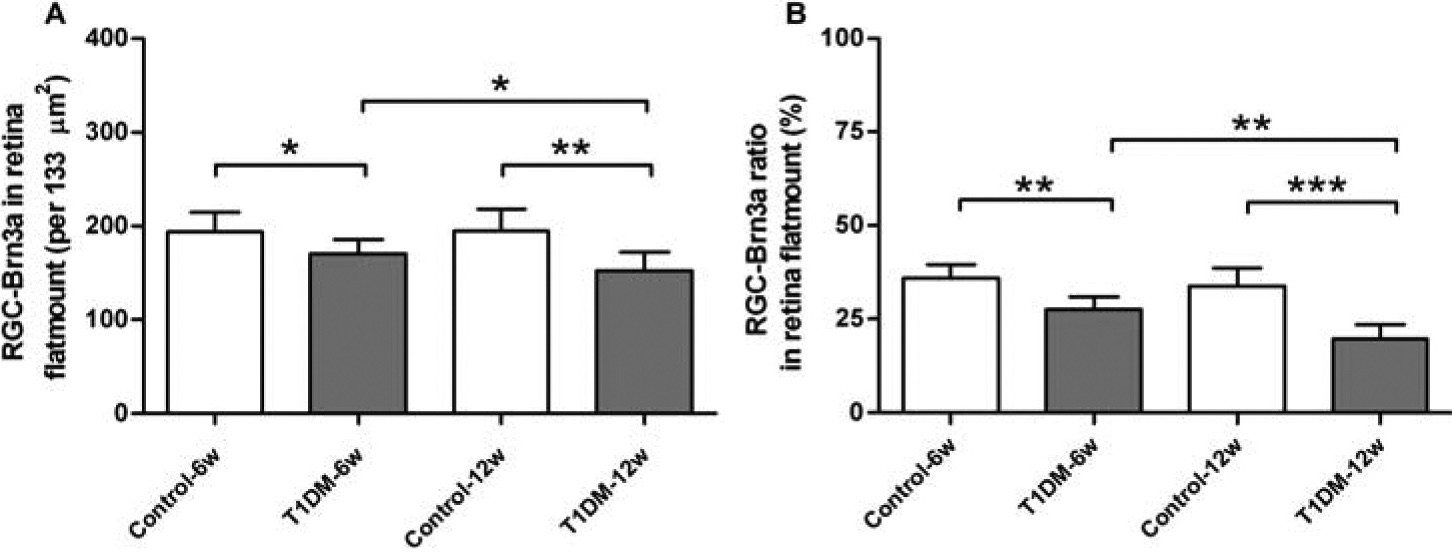
 Figure 5
of Yang, Mol Vis 2012; 18:1411-1420.
Figure 5
of Yang, Mol Vis 2012; 18:1411-1420.