Figure 4. Brn3a-labeled retinal
ganglion cells in flatmount retinas. Left: Brn3a signal (red);
middle: 4’,6’-diamino-2-phenylindole (DAPI) signal (blue);
right: superimposition of both images. The density of Brn3a+
RGCs in 6 and 12 weeks’ onset of diabetes and control mice are
shown in the images (each visual field represents a 133 μm2
area). All images were obtained at 40× magnification. Bar: 2 μm.
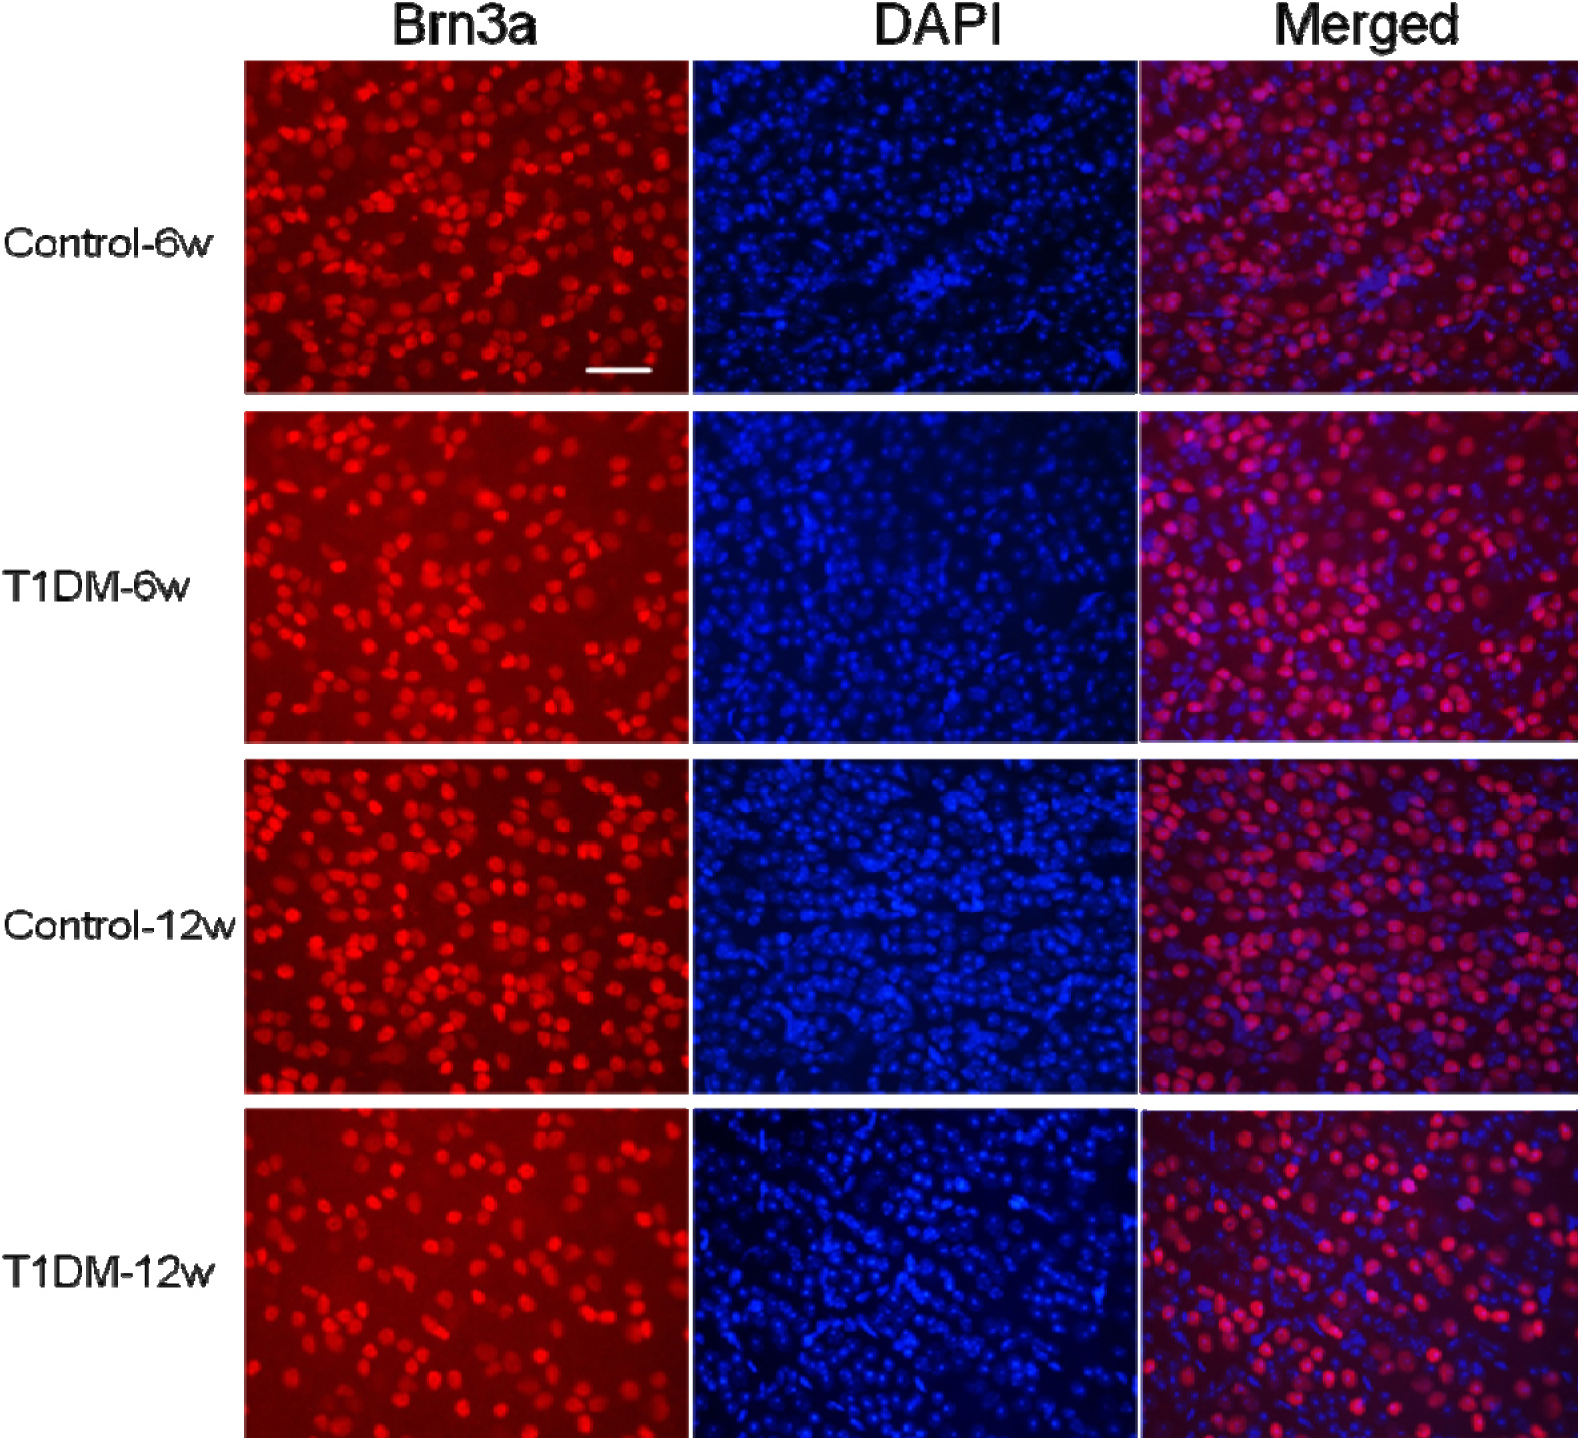
 Figure 4
of Yang, Mol Vis 2012; 18:1411-1420.
Figure 4
of Yang, Mol Vis 2012; 18:1411-1420.