Figure 3. Quantification of retinal
ganglion cell loss in the ganglion cell layer. Cell loss was
assessed by counting the cells with Brn3a (A) and NeuN (C)
immunoreactivity. The number of retinal ganglion cells (RGCs)
exhibits a significantly difference in diabetic and control mice
(n=10/group). In the percentage of RGCs for Brn3a (B) and
NeuN (D), both markers were calculated in relation to the
number of cells counted. Data are expressed as means±standard
deviation (SD; * indicates p<0.05, ** indicates p<0.01,
*** indicates p<0.001).
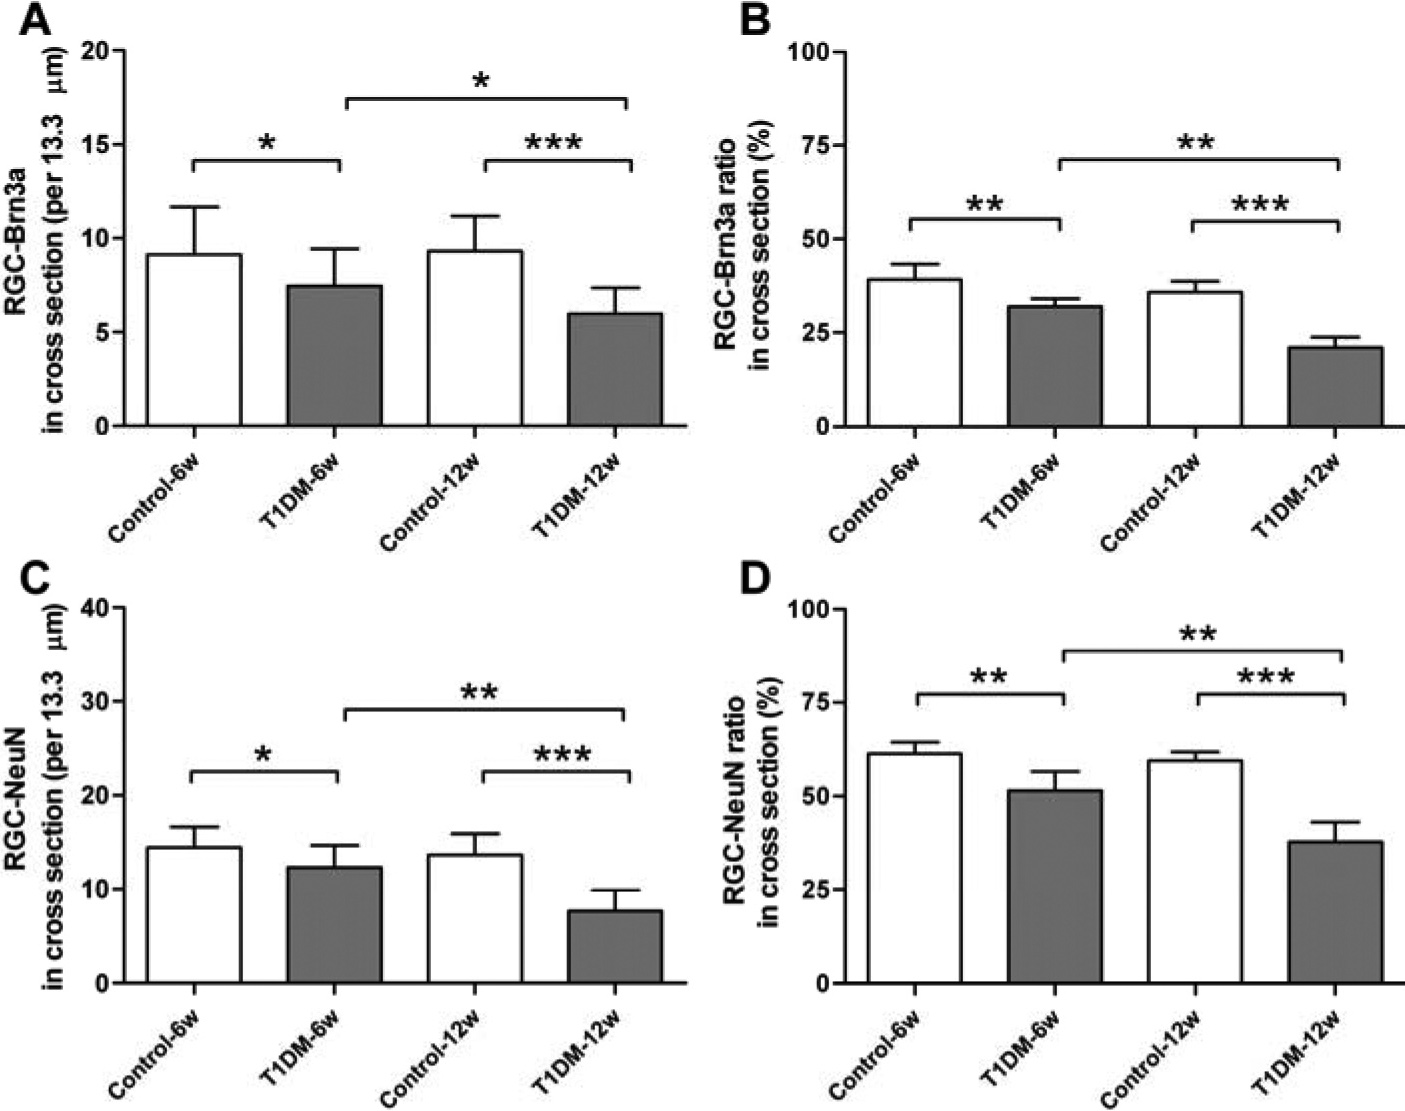
 Figure 3
of Yang, Mol Vis 2012; 18:1411-1420.
Figure 3
of Yang, Mol Vis 2012; 18:1411-1420.