Figure 2. TAZ protein expression is upregulated in mitotic cells at various cell cycle stage. A and B: Conjunctiva epithelial cells were stained by TAZ (red) after treating with hydrochloride for 15 min (A) or 40 min (B). Counterstaining with DAPI (blue) was performed as an indicator of cells at different cell cycle stages. White arrows indicate
the cells which were undergoing cell division. Scale bar is 20 µm. C: TAZ siRNA induced less 10–4-cyclin E promoter transcription activities in NHC cell lines in a dosage dependent manner. Data have
been represented as mean±se from three replicates.
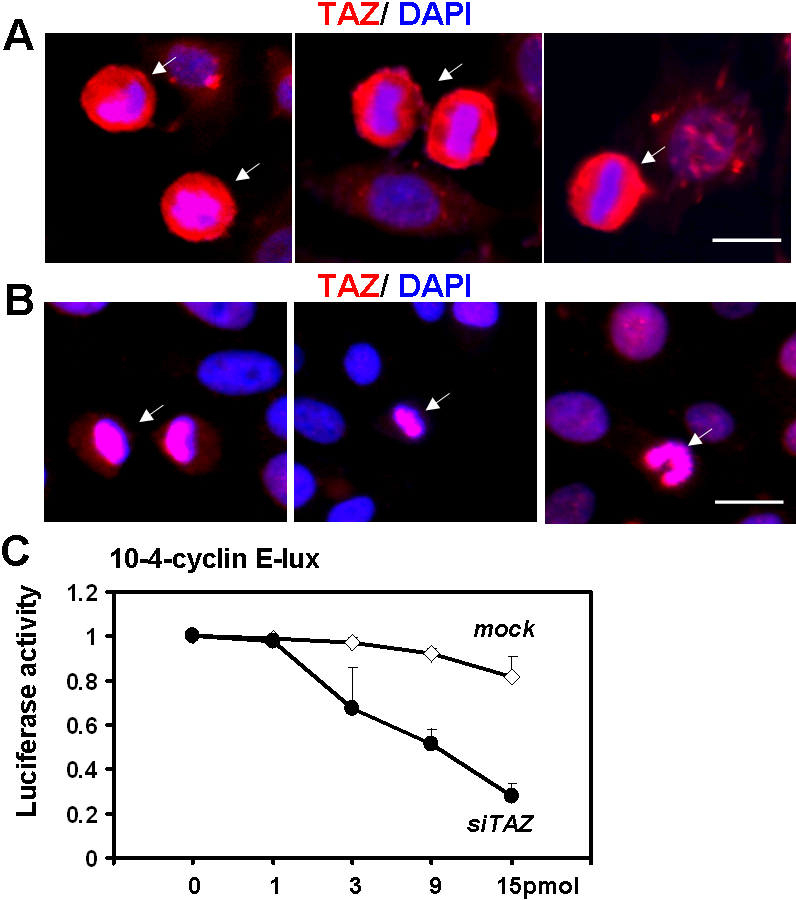
 Figure 2 of
Tan, Mol Vis 2012; 18:1402-1410.
Figure 2 of
Tan, Mol Vis 2012; 18:1402-1410.