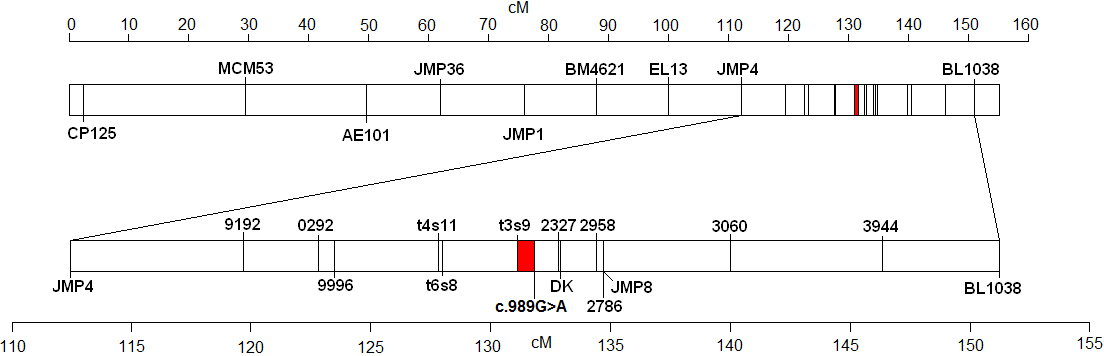
Figure 2. Schematic diagram of sheep chromosome 6. The rectangle at the top shows the entire chromosome, with the centromere on the
left and the telomere on the right. Vertical lines show the positions of markers used in linkage analysis. The linked region
from the latest
CRIMAP analysis is shown in red. The upper scale shows distance along the chromosome in centiMorgans. The lower rectangle shows
an expanded view of the region between markers JMP4 and BL1038. The linked region is also shown in red. The lower scale shows
distance along the expanded region of the chromosome in centiMorgans. BMS150 and BMS151 markers are indicated by the last
four digits of the marker name. Marker DK1183A is represented by DK.
 Figure 2 of
Wilson, Mol Vis 2012; 18:1384-1394.
Figure 2 of
Wilson, Mol Vis 2012; 18:1384-1394.