Figure 9. This figure represents microarray heat map displaying deregulated genes and microRNAs in Y79 cells either or not co-cultured
with microparticles. A: Heat map shows significantly upregulated and down-regulated genes in Y79 cells co-cultured with microparticles (3-D) when
compared with Y79 cells cultured without microparticles (2-D). B: Heat map shows significantly upregulated and down-regulated microRNAs in Y79 cells co-cultured with microparticles (3-D)
when compared with Y79 cells cultured without microparticles (2-D). Green color represents upregulated genes or microRNAs
and red color represents down-regulated genes or microRNAs. Heat map shows gene IDs or microRNA names and their respective
expression fold changes in Y79 cells co-cultured with microparticles (3-D) when compared with Y79 cells cultured with microparticles
(2-D).
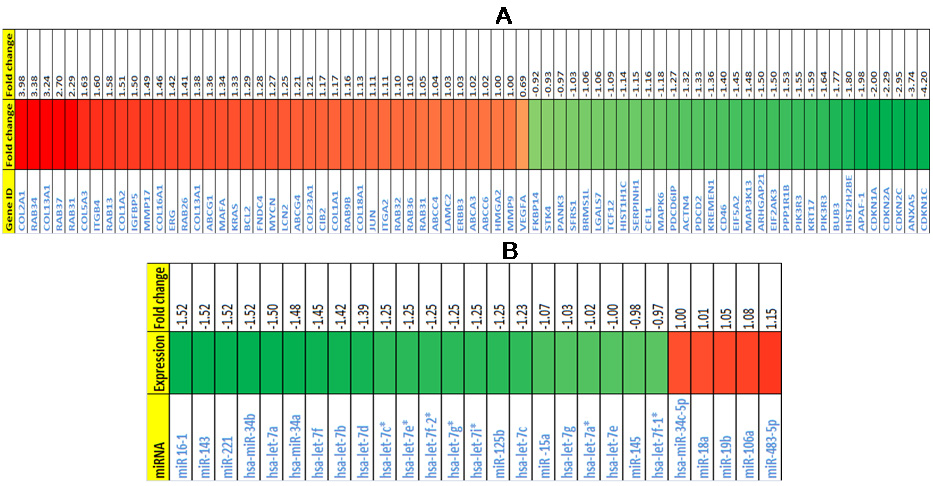
 Figure 9 of
Mitra, Mol Vis 2012; 18:1361-1378.
Figure 9 of
Mitra, Mol Vis 2012; 18:1361-1378.