Figure 8. This figure shows the uptake of doxorubicin drug by Y79 cells either or not co-cultured with microparticles using flow cytometry.
A: The flow cytometry histogram shows decreased uptake of drug by Y79 cells co-cultured with microparticles (3-D) when compared
to Y79 cells cultured without microparticles at 4 h. B: Flow cytometry histogram shows decreased uptake of a drug by Y79 cells co-cultured with microparticles (3-D) when compared
to Y79 cells cultured without microparticles at 24 h. The x-axis represent fluorescein isothiocyanate (FITC) intensity and
the y-axis represents cell counts.
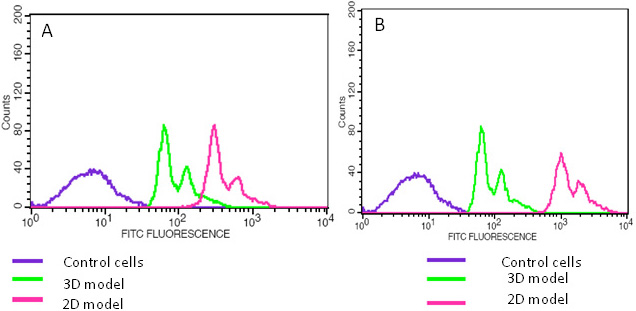
 Figure 8 of
Mitra, Mol Vis 2012; 18:1361-1378.
Figure 8 of
Mitra, Mol Vis 2012; 18:1361-1378.