Figure 6. This figure shows the comparison of post freeze and thaw viability of Y79 cells between Y79 cell culture without microparticles
(2-D) and Y79 cells co-cultured with microparticles (3-D). The bar diagram shows the viability of Y79 cultured cells with
(3-D) and without (2-D) microparticles retrieved from freezing. The Y79 cells viability was slightly higher in 3-D model compared
to that in 2-D monolayer (41% versus 35%). Error bars represent standard deviation obtained from triplicates.
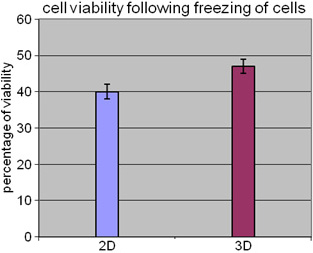
 Figure 6 of
Mitra, Mol Vis 2012; 18:1361-1378.
Figure 6 of
Mitra, Mol Vis 2012; 18:1361-1378.