Figure 4. This figure shows the growth kinetics of Y79 cells co-cultured with microparticles formulated with different concentrations
of gelatin (3% and 5% gelatin). The graph shows increased cell concentrations on 15th and 20th. Day of Y79 cell culture on
microparticles coated with 5% gelatin (p<0.01) when compared to that of 3% gelatin coated microparticles 0.01).
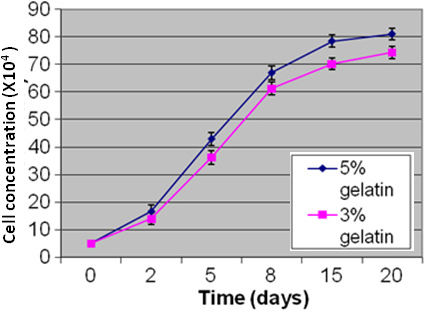
 Figure 4 of
Mitra, Mol Vis 2012; 18:1361-1378.
Figure 4 of
Mitra, Mol Vis 2012; 18:1361-1378.