Figure 10. This figure shows the real time quantitative PCR validation of selected genes from microarray results. A: Graph shows real time quantitative PCR analysis showing upregulated genes (dark bars) in Y79 cells co-cultured with microparticles
(3-D) when compared with Y79 cells cultured without microparticles (2-D). The fold change of respective genes in microarray
was also displayed (gray bars) for comparison. The genes that were upregulated in microarray analysis were also found to be
upregulated in quantitative real time PCR analysis. B: Graph shows real time quantitative PCR analysis showing down-regulated genes (dark bars) in Y79 cells co-cultured with microparticles
(3-D) when compared with Y79 cells cultured without microparticles (2-D). The fold change of respective genes in microarray
was also displayed (gray bars) for comparison. The genes that were down-regulated in microarray analysis were also found to
be down-regulated in quantitative real time PCR analysis. The error bars represent the data in triplicates.
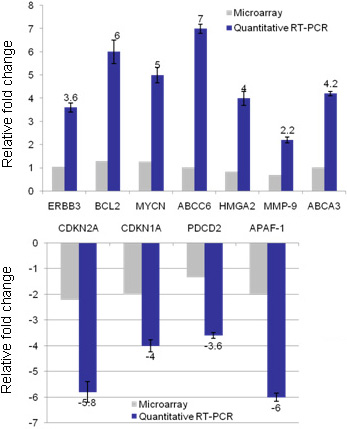
 Figure 10 of
Mitra, Mol Vis 2012; 18:1361-1378.
Figure 10 of
Mitra, Mol Vis 2012; 18:1361-1378.