Figure 5. Sirtuin1 (SIRT1) induced
vascular endothelial growth factor (VEGF) release. A:
Evaluation of VEGF levels in the conditioned media after the
exposure of choroidal endothelial cells with hypoxia with or
without blocking SIRT1 activity (200 uM sirtinol; mean+SE; n=3;
*p<0.05) using enzyme-linked immunosorbent assay (ELISA). The
x-axis represents the experimental conditions and the y-axis
represents the VEGF protein levels in pg/ml. B:
Correlation of SIRT1 levels measured in the presence of
escalating VEGF. The x-axis represents the observed mean VEGF
protein levels in pg/mL and y-axis represents their respective
SIRT1 levels.
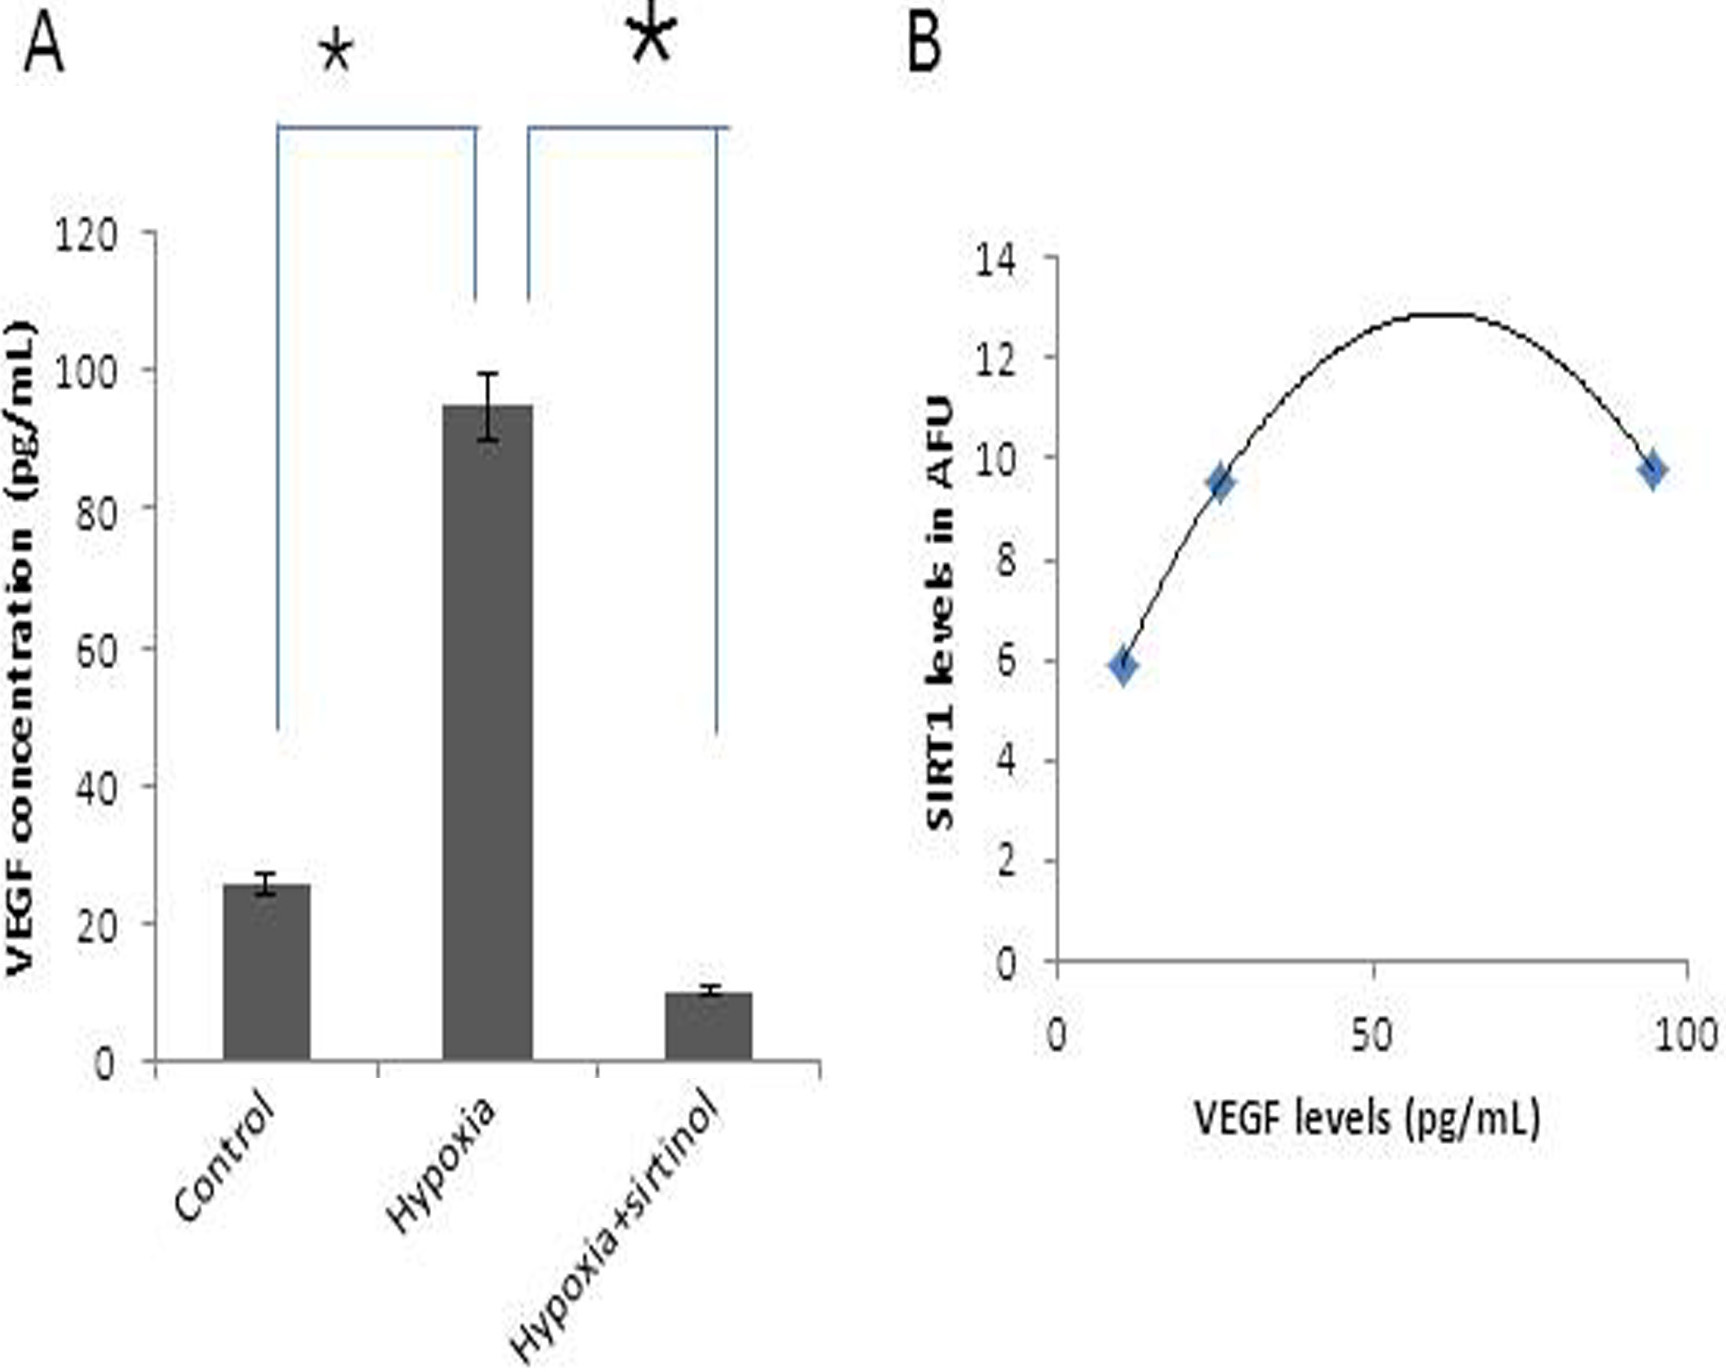
 Figure 5
of Balaiya, Mol Vis 2012; 18:114-120.
Figure 5
of Balaiya, Mol Vis 2012; 18:114-120.