Figure 6. Retinal function measured
by electroretinography (ERG) in rats fed for eight weeks and
maintained under cyclic dim or bright light. A: Scotopic
ERG-A and B wave amplitudes of rats fed for eight weeks and
maintained in cyclic dim light (DL, 50 lux; n=12; one-way
ANOVA). B: Scotopic ERG-A and B wave amplitudes of rats
fed for eight weeks and maintained in cyclic bright light (BL,
200 lux; n=12; one-way ANOVA). CONT+DL: Rats fed with
control diet and maintained under cyclic dim (50 lux) light
for eight weeks; CAPE+DL: Rats fed with CAPE diet and maintained
under cyclic dim (50 lux) light for eight weeks; CONT+BL:
Rats fed with control diet and maintained under cyclic bright
(200 lux) light for eight weeks; CAPE+BL: Rats fed with
CAPE diet and maintained under cyclic bright (200 lux)
light for eight weeks. (n=12; *: p<0.01, **: p<0.001,
one-way ANOVA).
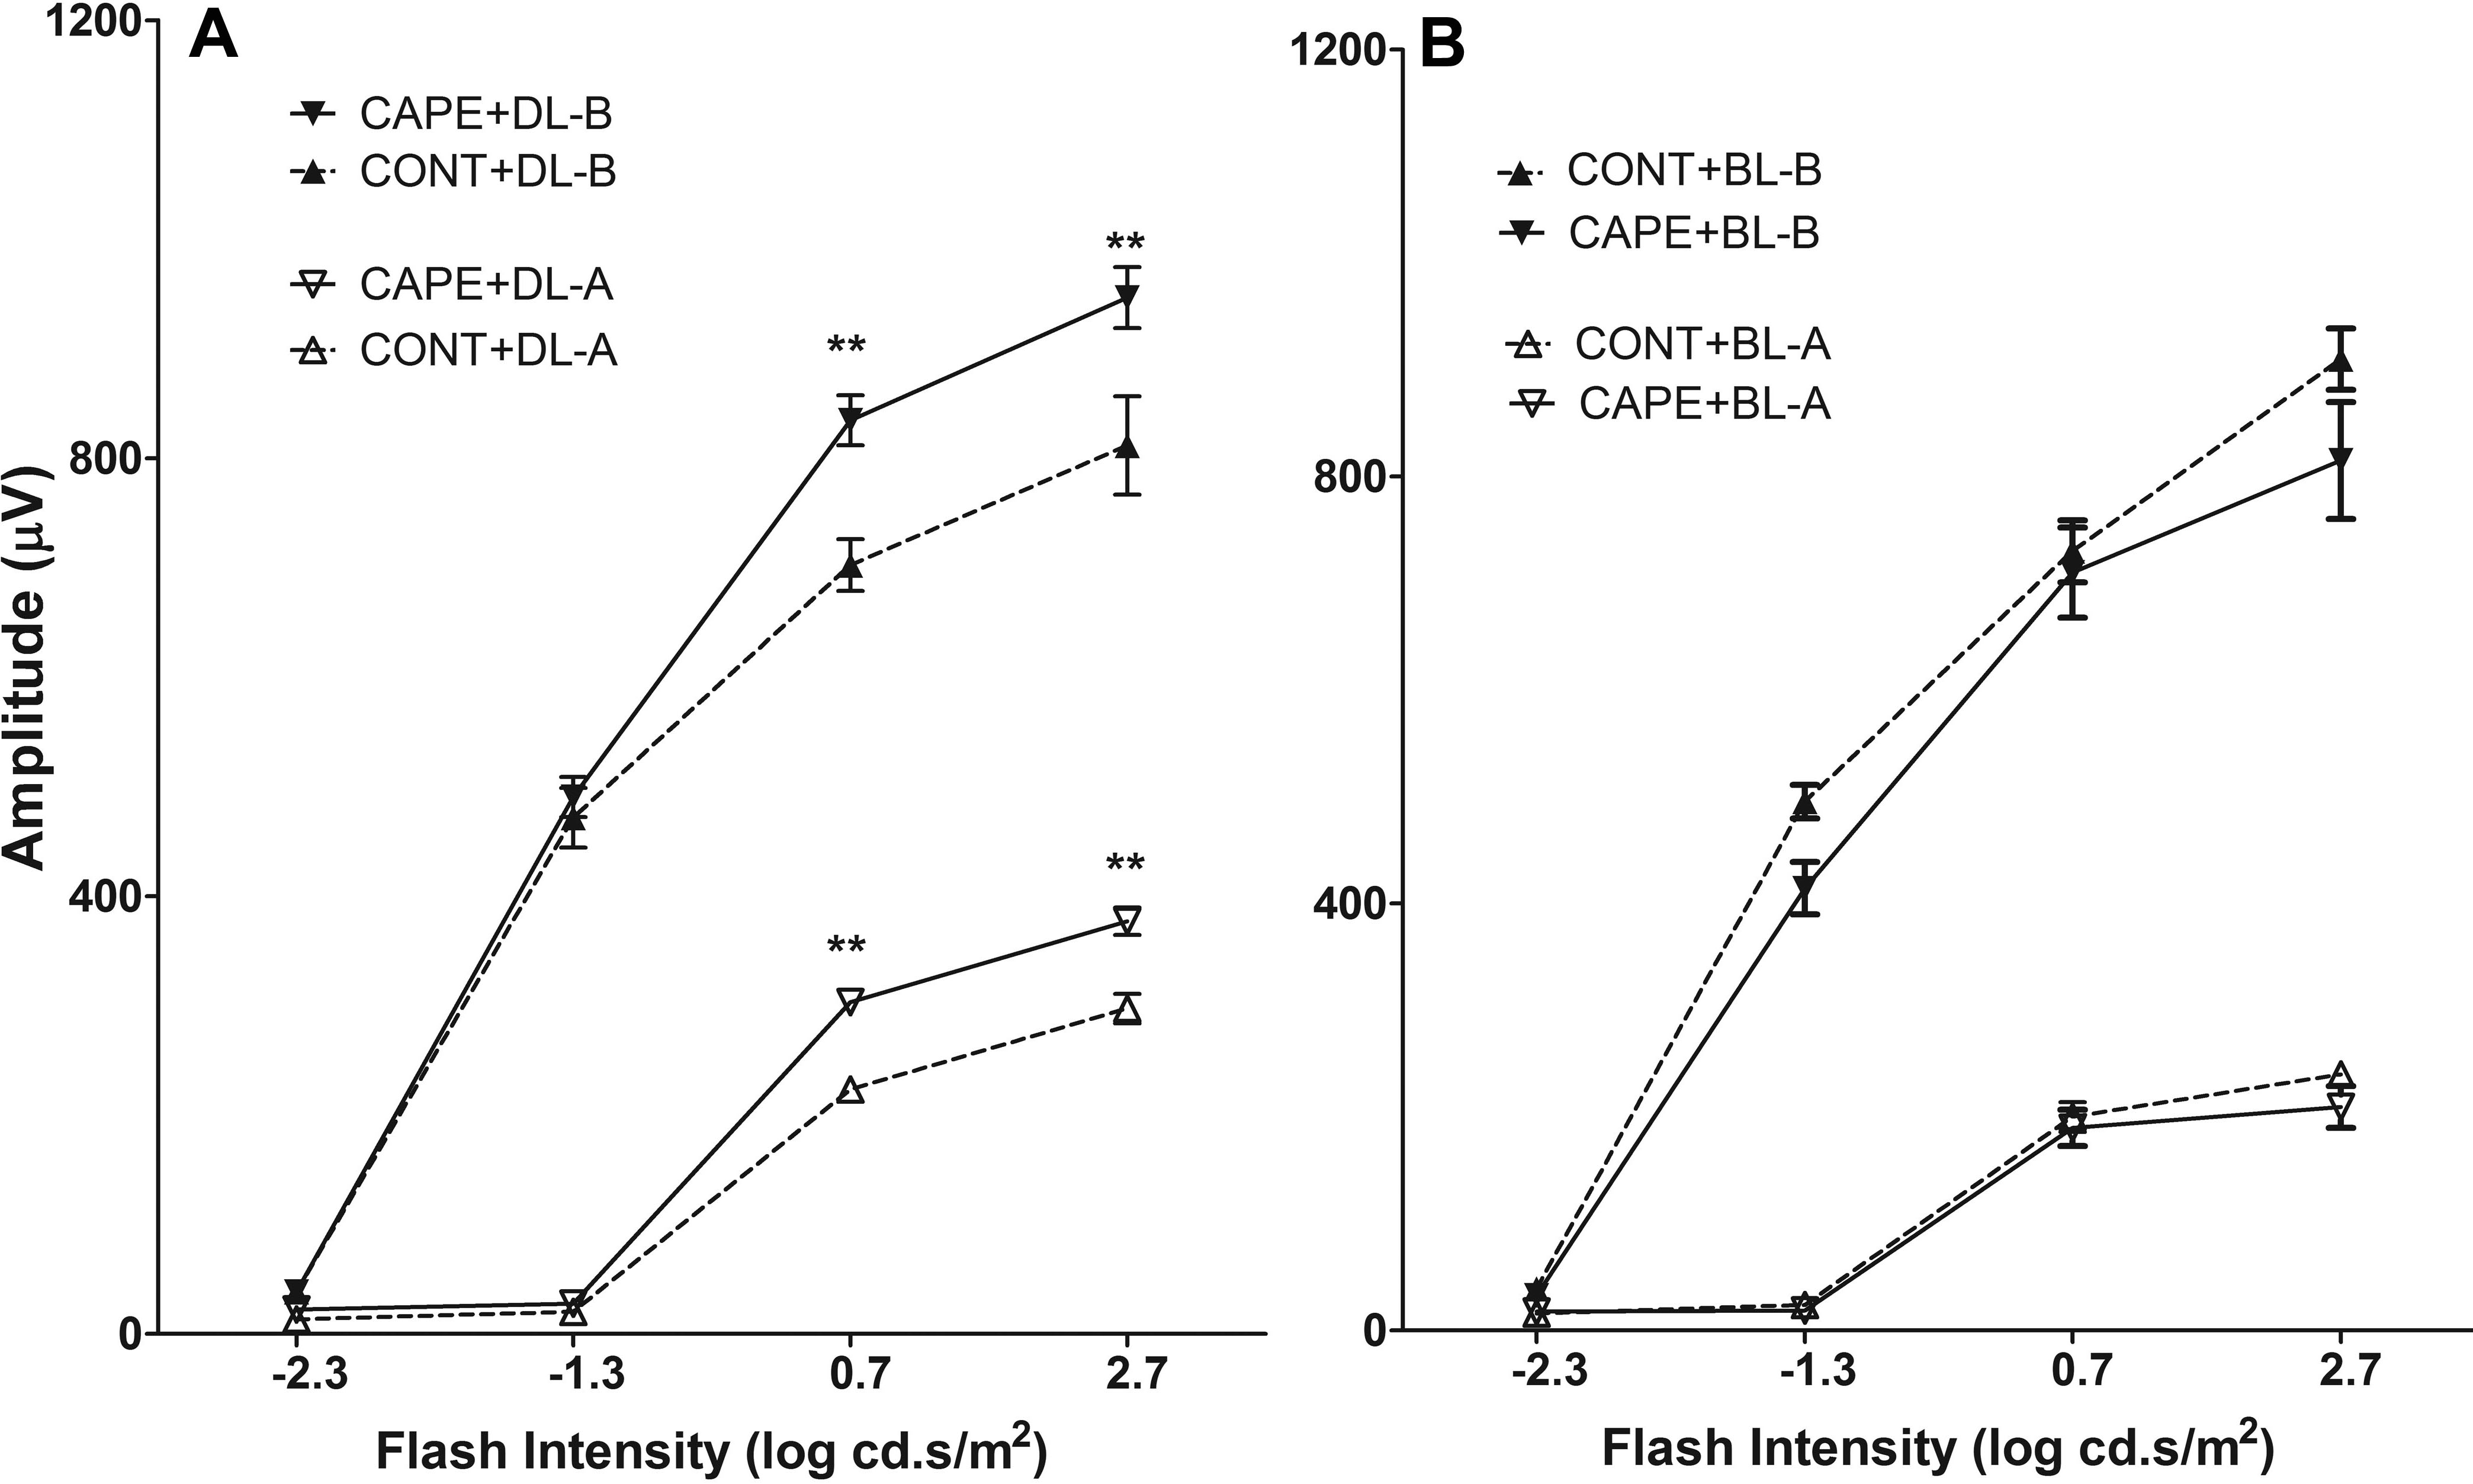
 Figure 6
of Chen, Mol Vis 2012; 18:1325-1338.
Figure 6
of Chen, Mol Vis 2012; 18:1325-1338.