Figure 2. Gene expression in 661W
cells was measured by quantitative reverse transcriptase PCR
(qRT–PCR). Gene expression was analyzed with the comparative Ct
value method after normalizing against the housekeeping gene, Rpl19.
Expression values (±SD) are presented against fold change over
no-treatment value, which was set to 1.0 (n=3 samples ×3
replication assay per sample). No treatment: no treatment with
CAPE or H2O2; H2O2:treated
with 1 mM of H2O2 for 6 h; caffeic
acid phenethyl ester (CAPE): treated with 5 μM CAPE for 3 h; H2O2
+ CAPE: treated with 5 μM CAPE for 3 h, and then treated with
1 mM of H2O2 for 6 h (*: p<0.05;
**: p<0.01, by the Student t test).
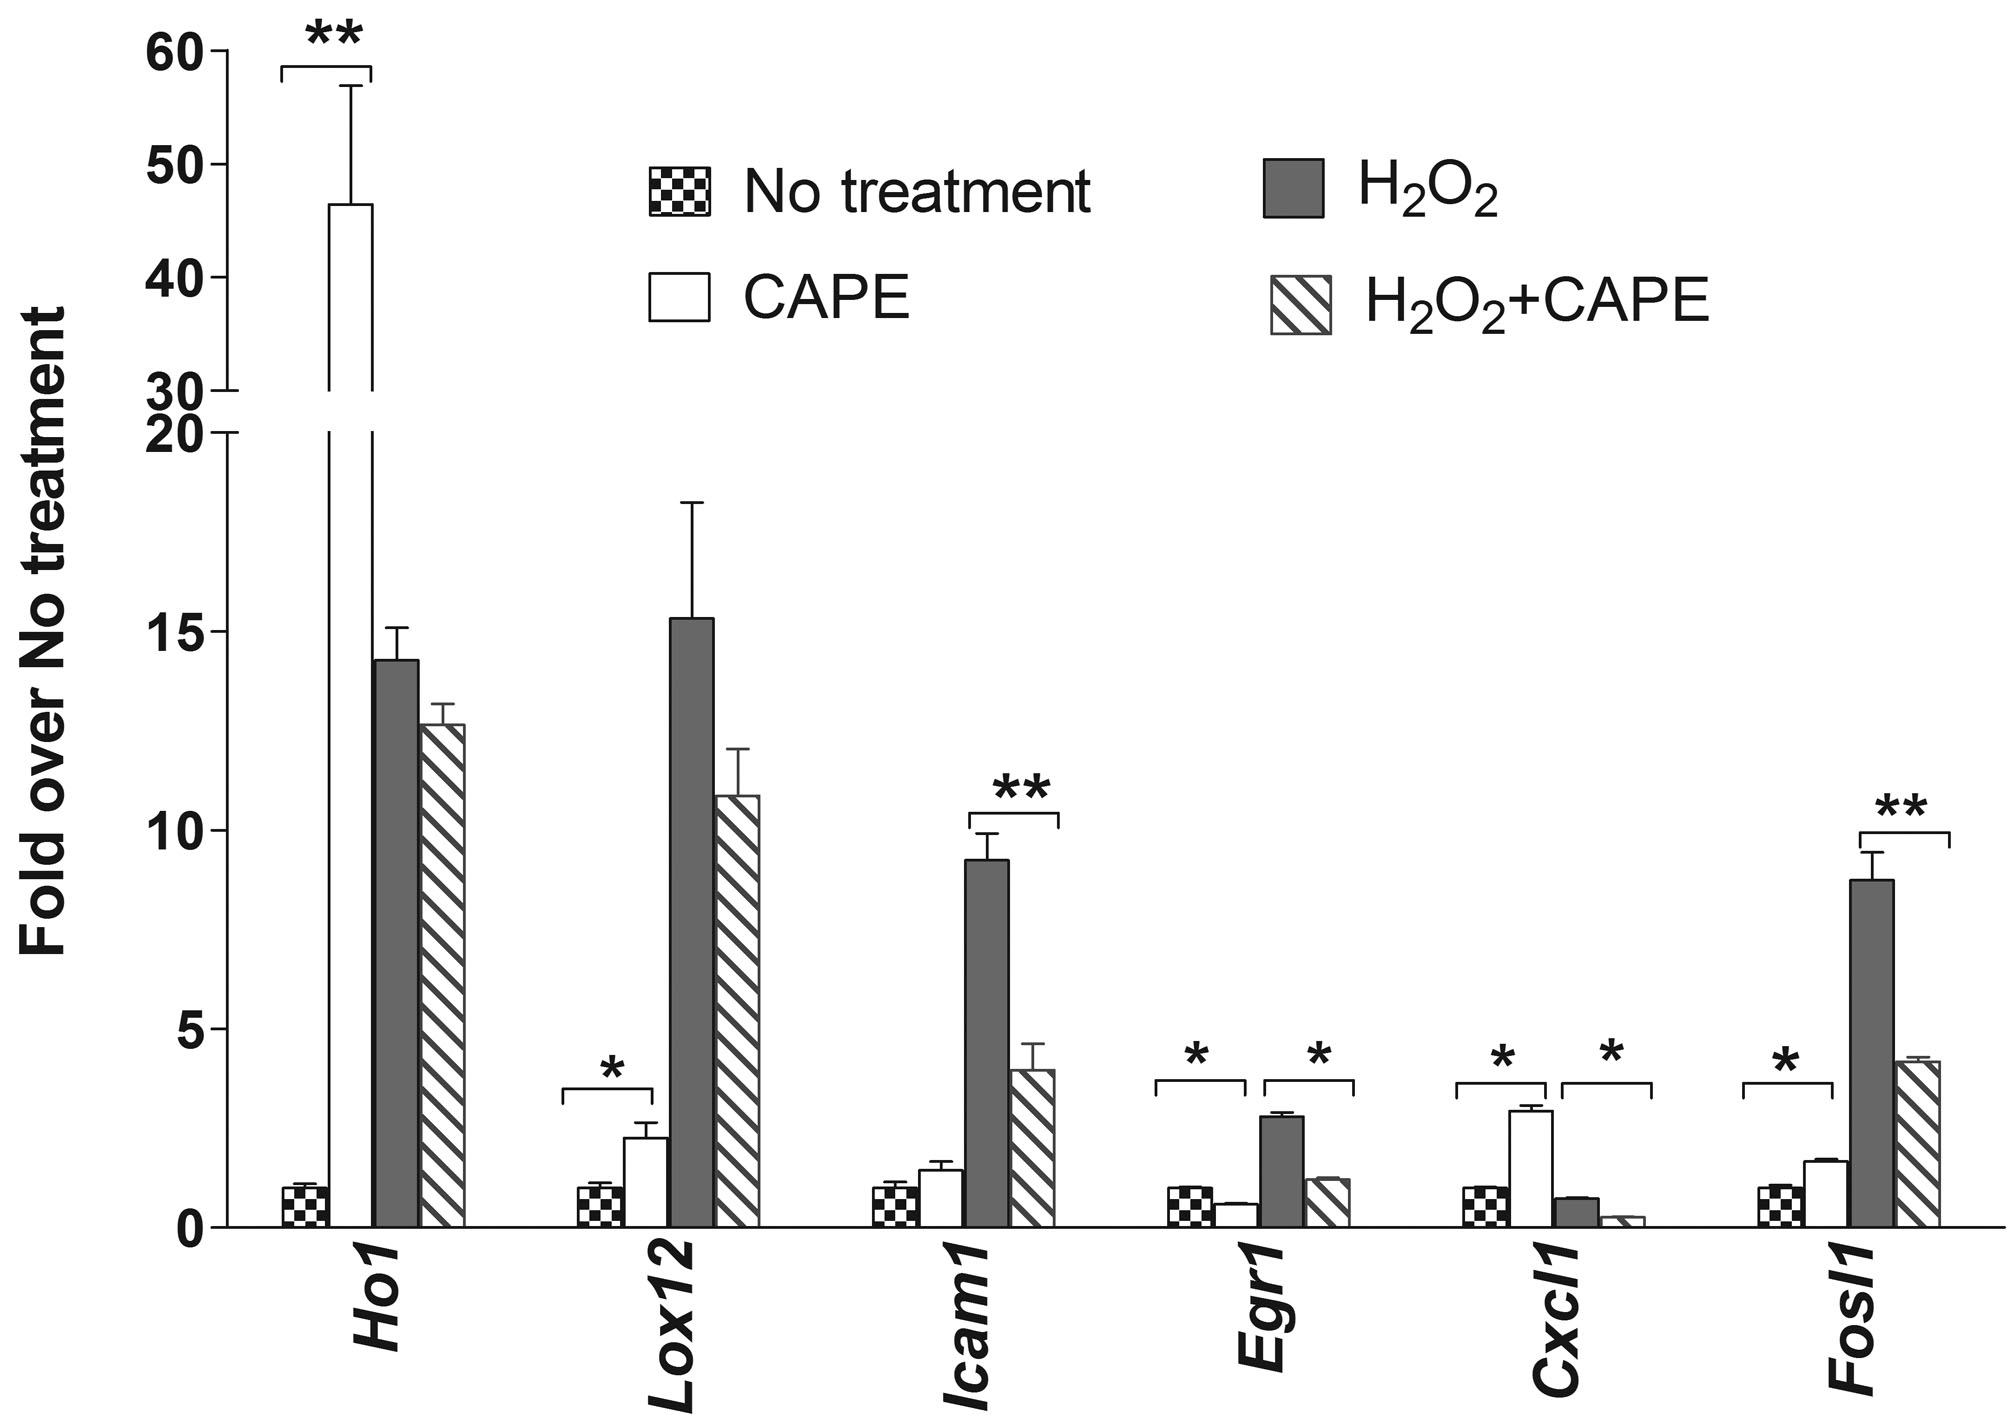
 Figure 2
of Chen, Mol Vis 2012; 18:1325-1338.
Figure 2
of Chen, Mol Vis 2012; 18:1325-1338.