Figure 2. Proportion of sites that were methylated in the proximal promoter and a portion of exon 1. A: Form-deprived, contralateral control, and normal control eyes after four weeks of monocular form deprivation. B: Form-deprived, contralateral control, and normal control eyes after one week of recovery following four weeks of monocular
deprivation (MD). Detailed maps of cytosine-phosphate-guanine (CpG) sites in the proximal promoter and first exon are shown.
The beads in the horizontal lines illustrate the CpG sites, and the color of each indicates the corresponding degree of methylation:
gray, 0–0.1; blue, 0.1–0.2; green, 0.2–0.3, red, >0.3. MD-T: monocular deprivation-treated eyes, MD-C: contralateral control
eyes, NC: age-matched normal control eyes, Numbers: sample IDs.
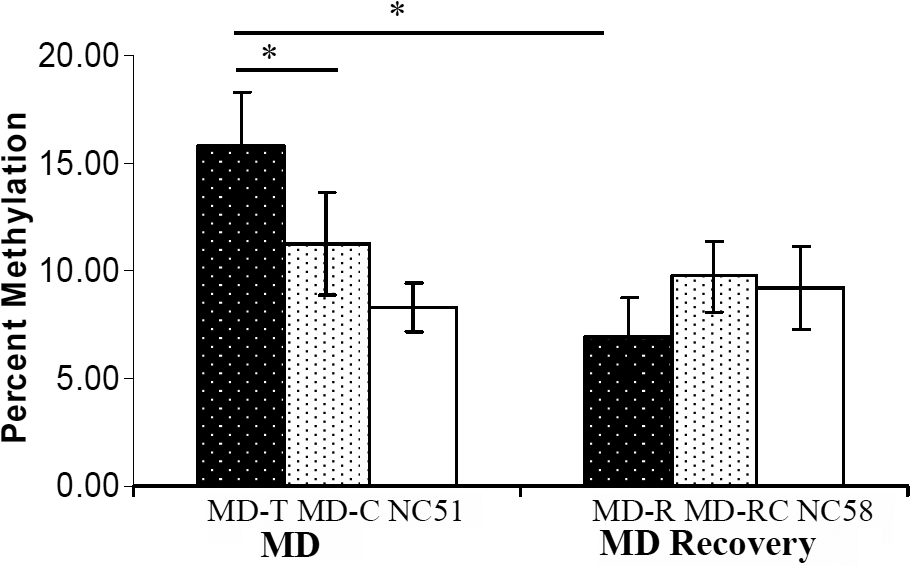
 Figure 2 of
Zhou, Mol Vis 2012; 18:1312-1324.
Figure 2 of
Zhou, Mol Vis 2012; 18:1312-1324.