Figure 4. Illustration of the
homozygous regions and the IBD interval in the four probands.
The regions of homozygosity, which range from 330 kb to 10.4 Mb,
include a 330 kb IBD interval common to all probands (red line).
This interval contains ZDHHC21 and CER1, and is
16 kb 3′ of FREM1’s last exon. Homozygosity mapping
defined one IBD interval suggesting that mutation responsible
for MOTA lies within the narrow 330 kb region.
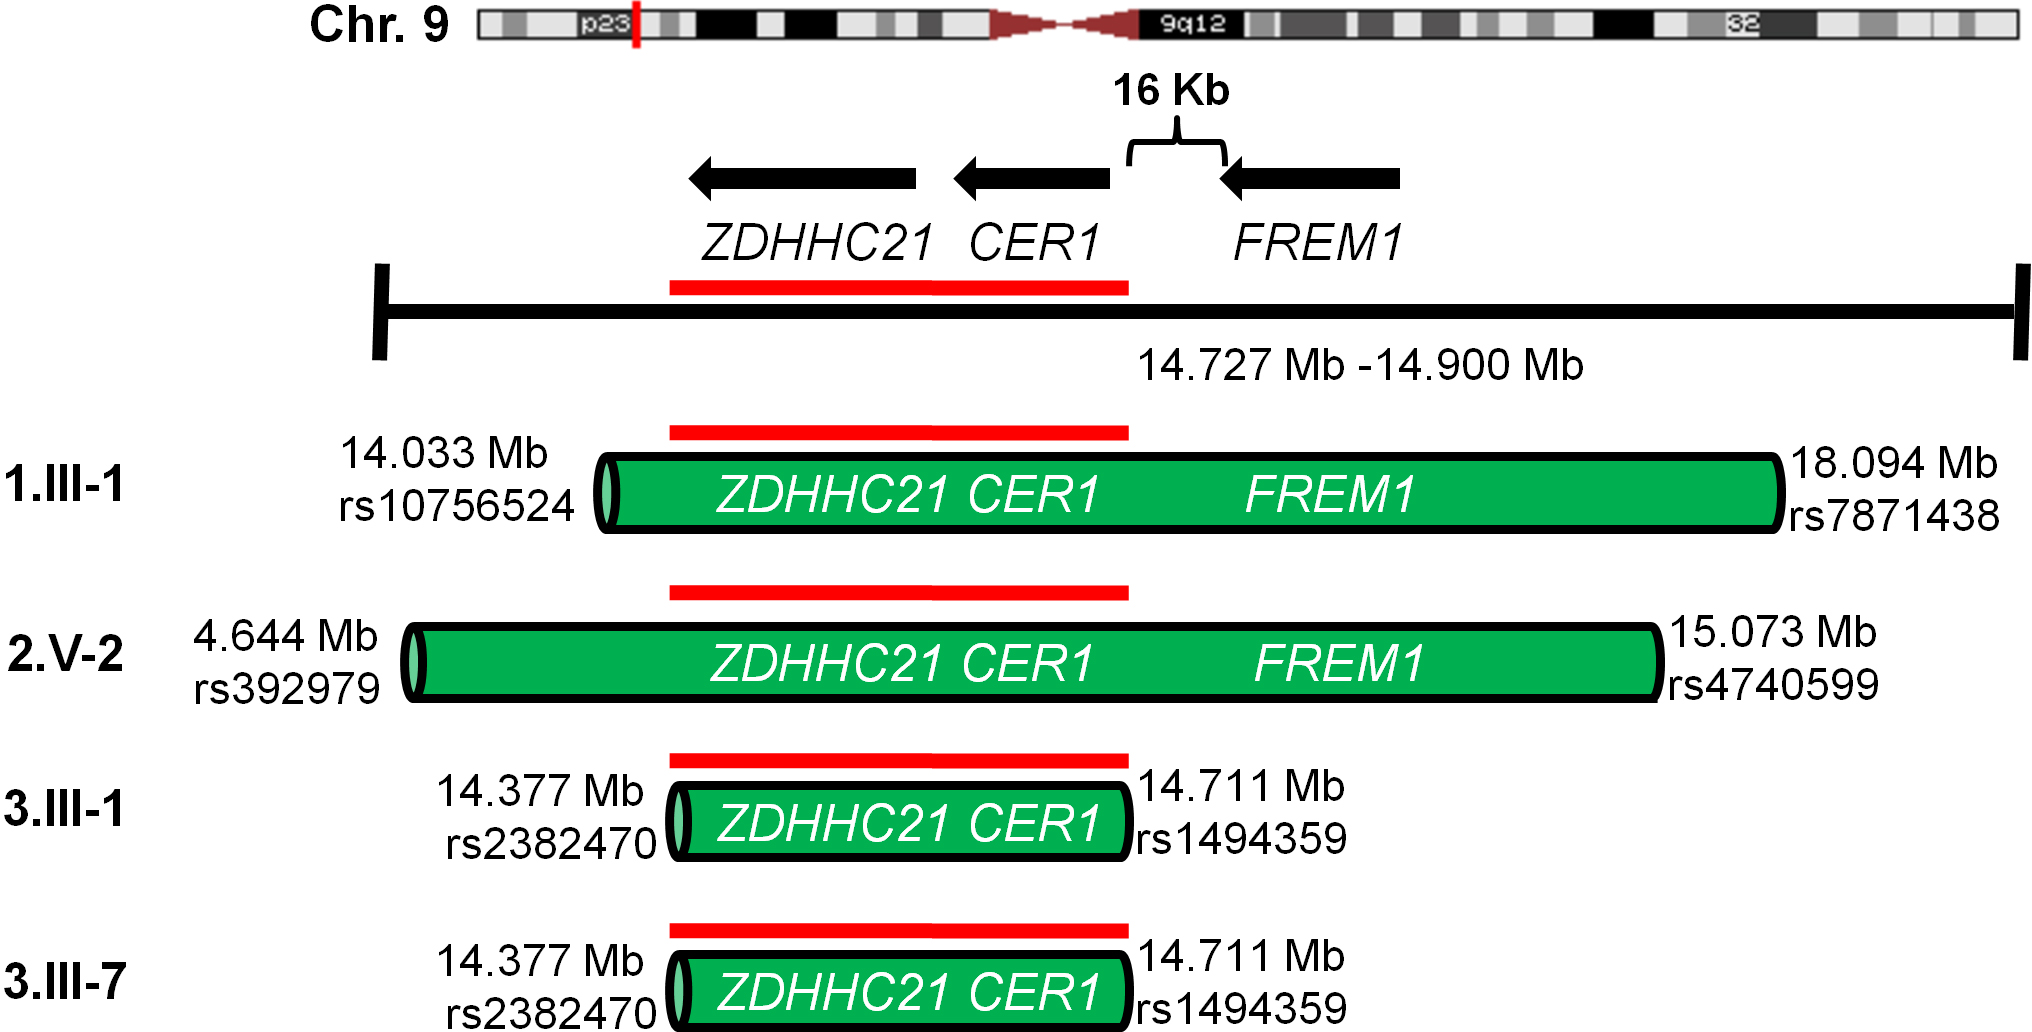
 Figure 4
of Mateo, Mol Vis 2012; 18:1301-1311.
Figure 4
of Mateo, Mol Vis 2012; 18:1301-1311.