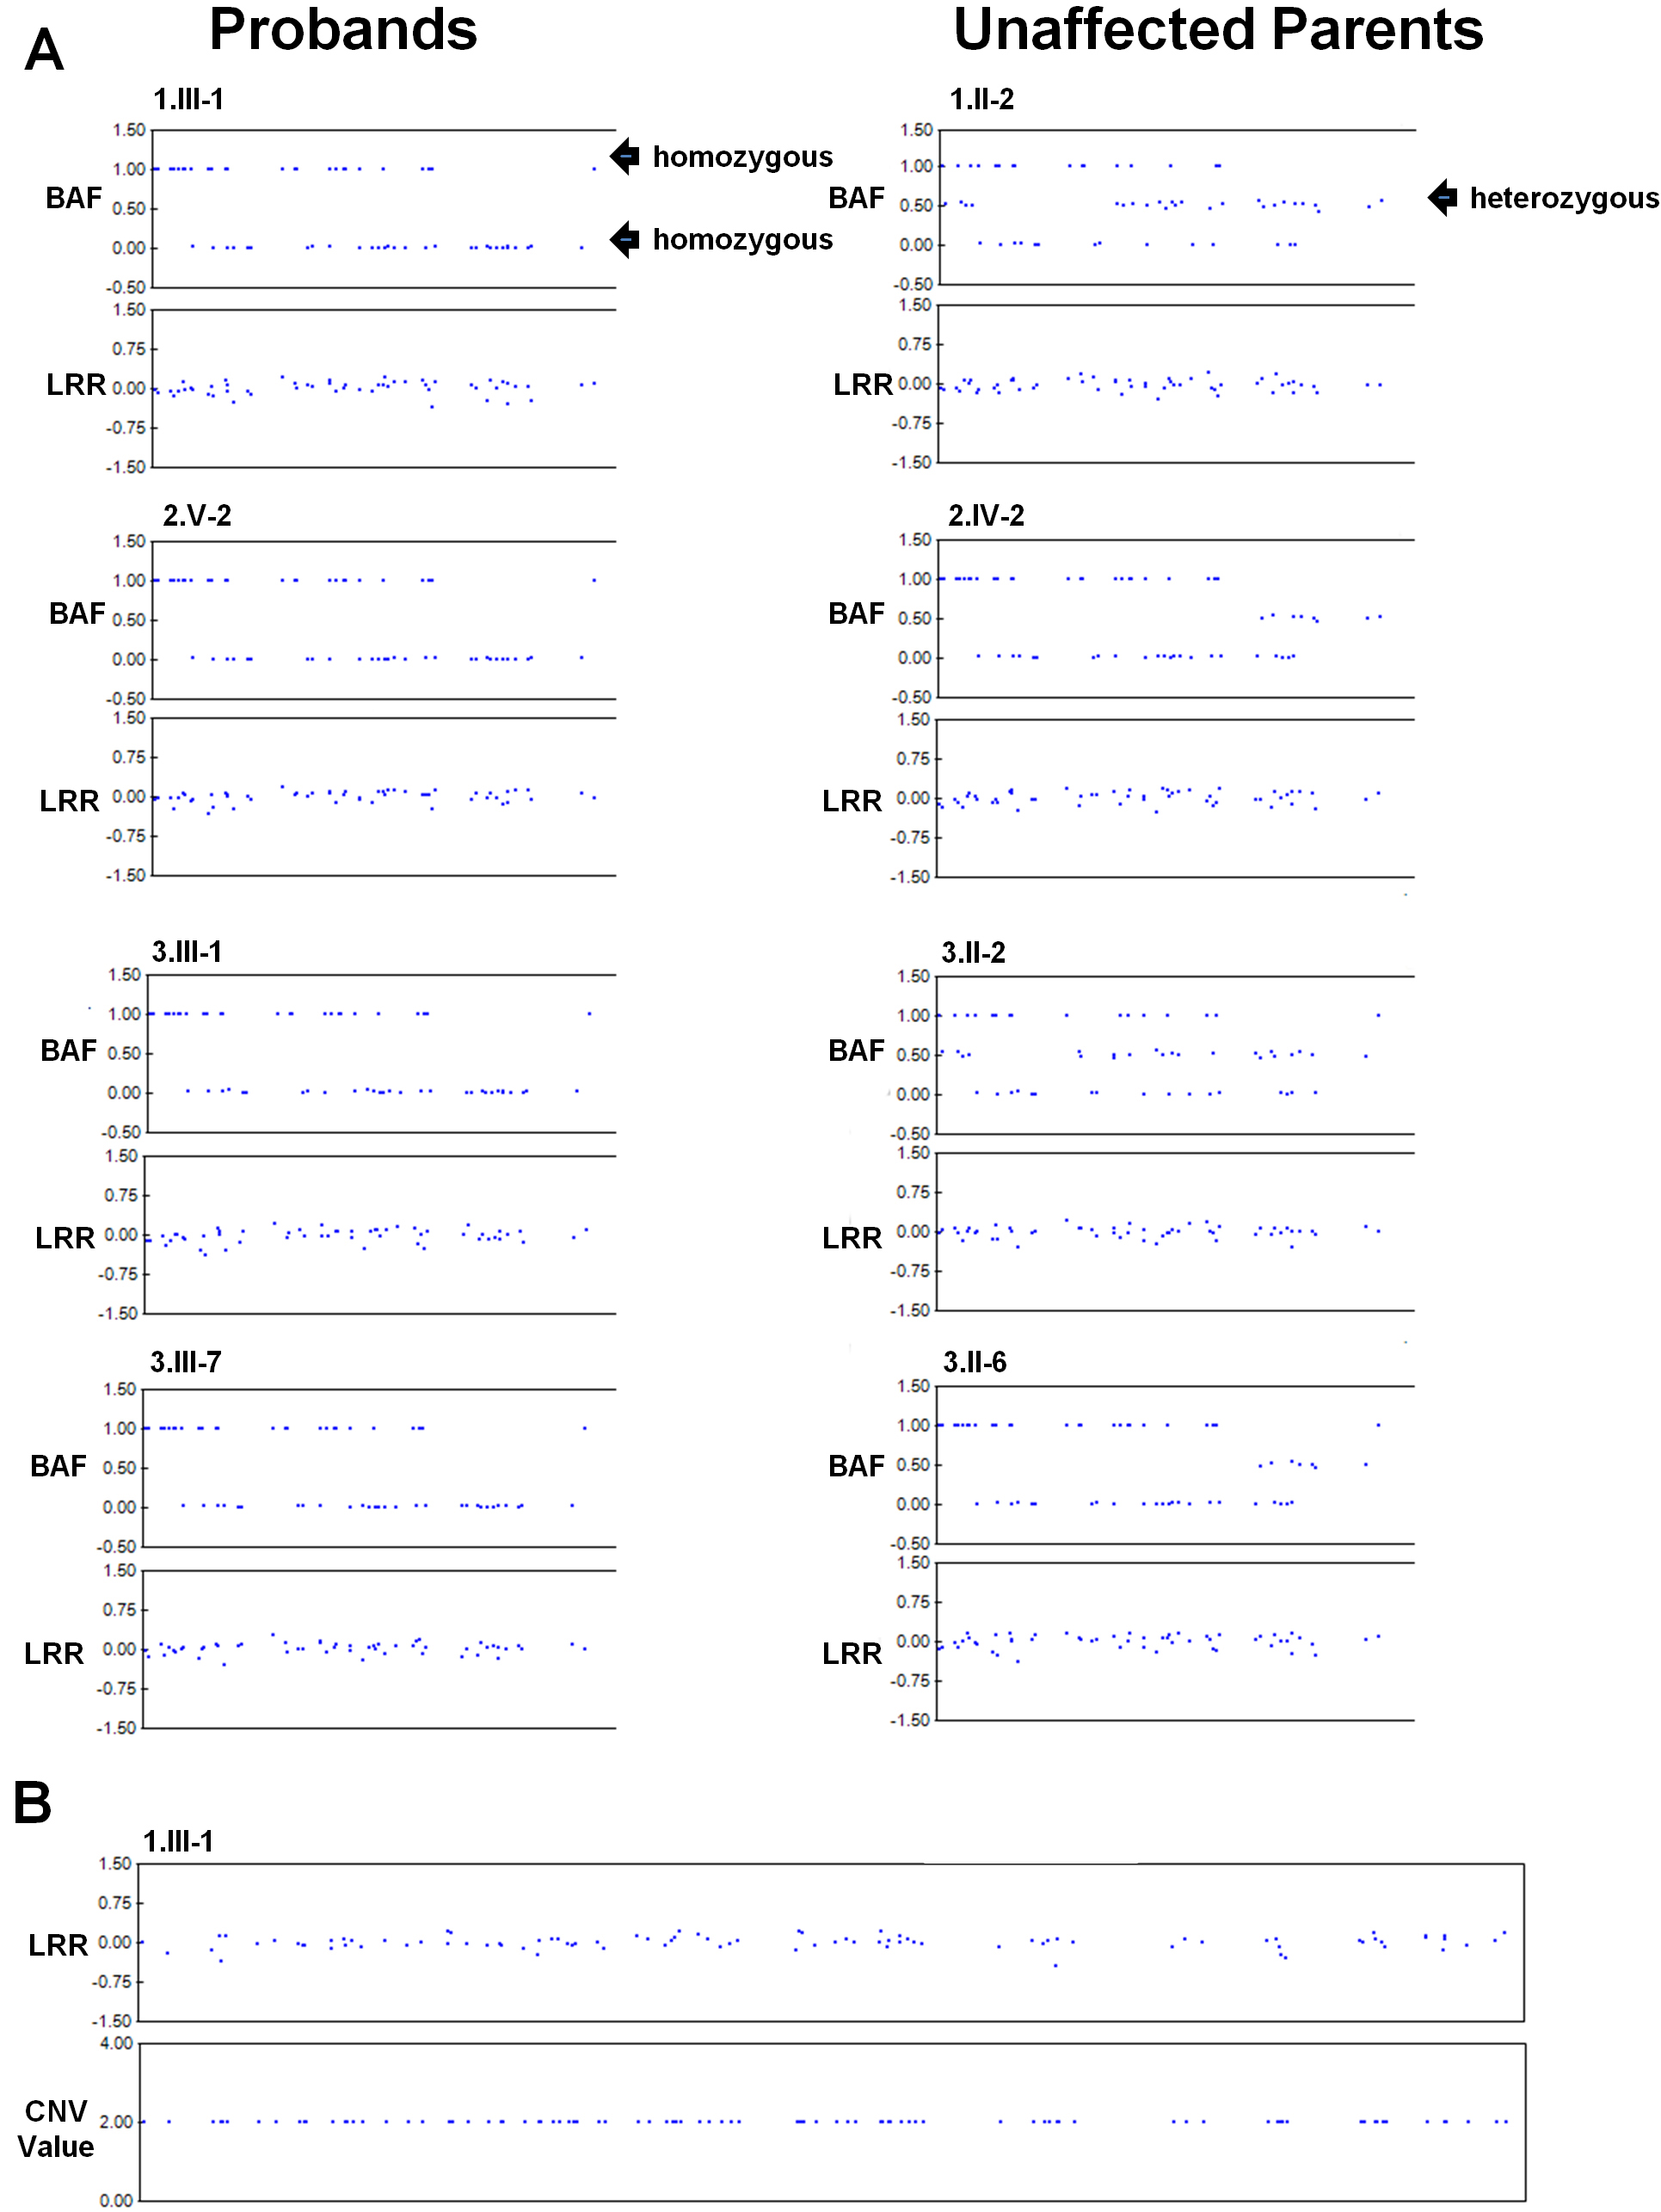
Figure 3. Montage illustrating
representative genotype and copy number data across the IBD
interval and
FREM1.
A: Genotype status (upper
panels) and copy number data (lower panels) are provided for the
first 55 SNPs in the IBD region (Chr9: 14,377,817–14,484,388).
The BAF plots demonstrate homozygosity in the probands (BAF=1 or
0) and heterozygosity in the unaffected parents (BAF=0.5). The
LRR plots also suggest no CNVs are present (LRR ~0).
B:
The lack of CNVs in
FREM1 (14,727,151–14,900,234) is
evident from LRR plots.
CnvPartition
did not detect any CNVs in this region as all 96 SNPs in this
region were assigned a normal CNV value of 2.
 Figure 3
of Mateo, Mol Vis 2012; 18:1301-1311.
Figure 3
of Mateo, Mol Vis 2012; 18:1301-1311.