Figure 3. Expression profiles of limbal stromal (LS) at passage 6 and corneal stromal (CS) cells at passage 4 by FACS analysis. The
two populations of cells have very similar expression where they expressed mesenchymal markers and absence of hematopoietic
markers and endothelial marker (CD31). The cells did not express ABCG2 and other embryonic stem cells markers. The green line
in the histograms represents the isotype controls.
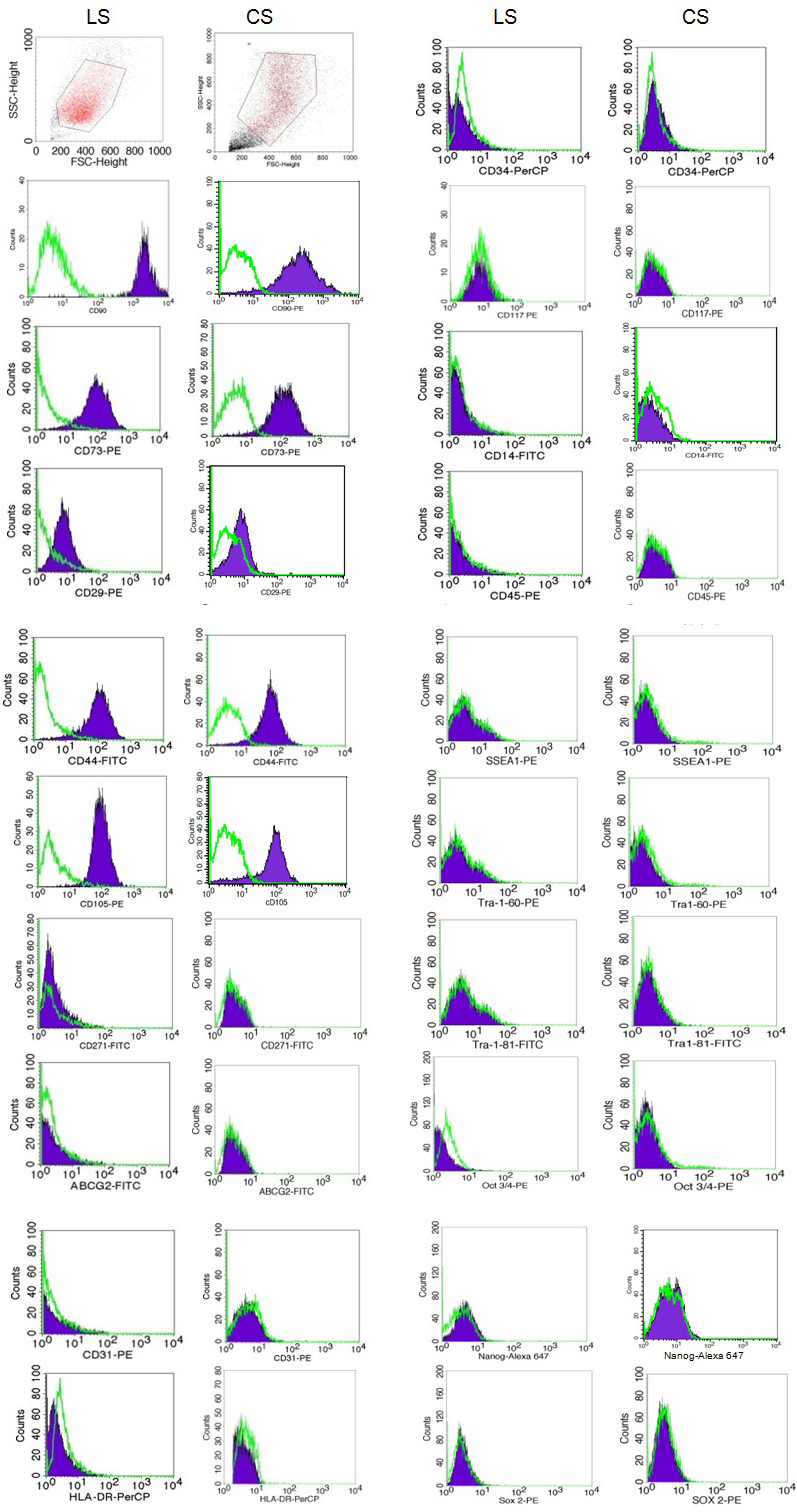
 Figure 3 of
Lim, Mol Vis 2012; 18:1289-1300.
Figure 3 of
Lim, Mol Vis 2012; 18:1289-1300.