Figure 4. Transcription analysis of the mutant CRYBA1/A3 gene. A: RT–PCR products separated on a 2% agarose gel. CRYBA1-wt (RT–PCR products from the 293T cells transfected with pc3.1-CYRBA1-wt)
showed a minor band, about 260 bp; CRYBA1-mt (RT–PCR products from the 293Tells transfected with pc3.1-CYRBA1-mt) showed a
major band, about 1,992 bp. B: Graphic presentation of wild and mutant transcript, with the wild type indicating that exon 3-exon 4 were combined, except
for intron 3, and the mutant transcript indicating that exon 3-intron 3-exon 4 were combined. C: Flank sequence of splice mutation. The red font indicates mutant base, the additional 24 amino acid residues are marked
by underline and the stop coden is marked by black frame.
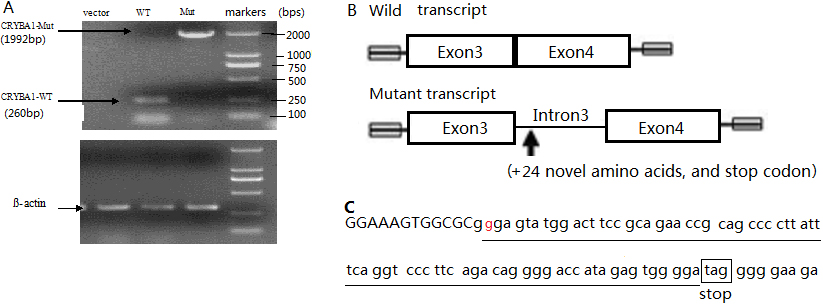
 Figure 4 of
Yang, Mol Vis 2012; 18:1283-1288.
Figure 4 of
Yang, Mol Vis 2012; 18:1283-1288.