Figure 3. Partial sequence of CRYBA1/A3 at exon3. A: Sequence of affected individual (individual III:11). B: Sequence of unaffected individual (individual III:7). In panel A, the heterozygous mutation IVS3+2 T→G was evident at the flanking splicing junction. This was identified in all the affected
participants, but was not found in unaffected family members or in the 100 unrelated control subjects.
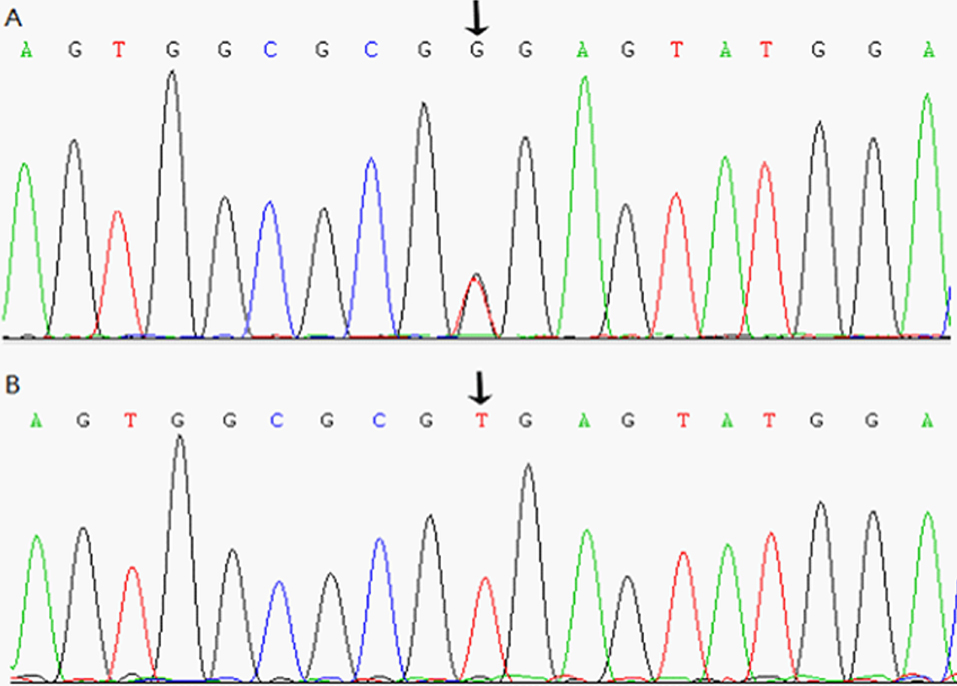
 Figure 3 of
Yang, Mol Vis 2012; 18:1283-1288.
Figure 3 of
Yang, Mol Vis 2012; 18:1283-1288.