Figure 2 of
Kobayashi, Mol Vis 2012; 18:1271-1277.
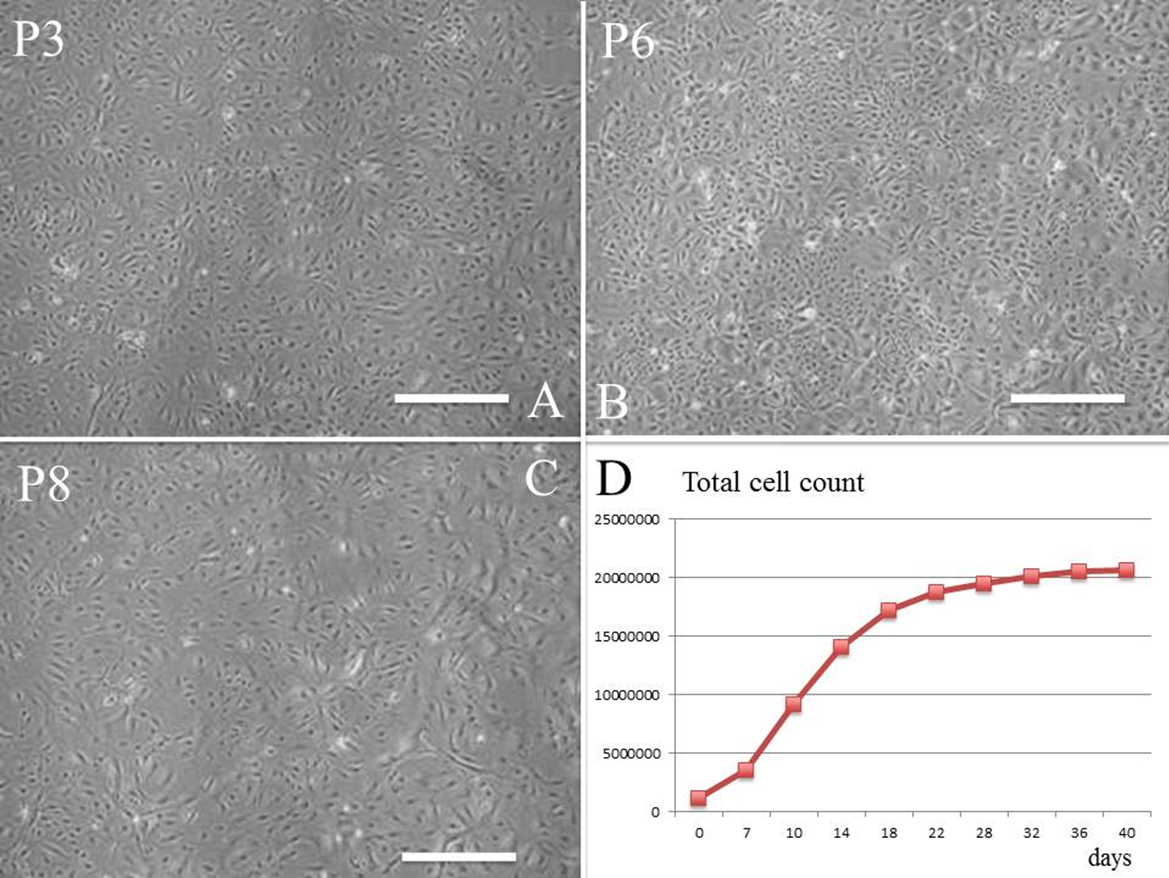
Figure 2.
Subcultures of newborn mouse lacrimal gland epithelial cells with CT. Cells at P3 (
A
), P6 (
B
), and P8 (
C
) after 2 days.
D
: The total number of expanded lacrimal gland epithelial cells is shown. Scale bars, 100 µm.
 Figure 2 of
Kobayashi, Mol Vis 2012; 18:1271-1277.
Figure 2 of
Kobayashi, Mol Vis 2012; 18:1271-1277.