Figure 4. Mutation spectrum of SAG. The location of the known and new sequence variants are depicted above and below the gene (in cDNA notation; upper panel)
and protein (in amino acid notation; lower panel), respectively. Oguchi associated mutations are indicated in blue letters
while the Oguchi and retinitis pigmentosa associated mutation is shown in dark orchid color. The novel nonsense mutation (c.916G>T;
p.Glu306X) is depicted in black letters below the gene and the predicted protein, which hypothetically would result in a protein
with a severely truncated C domain.
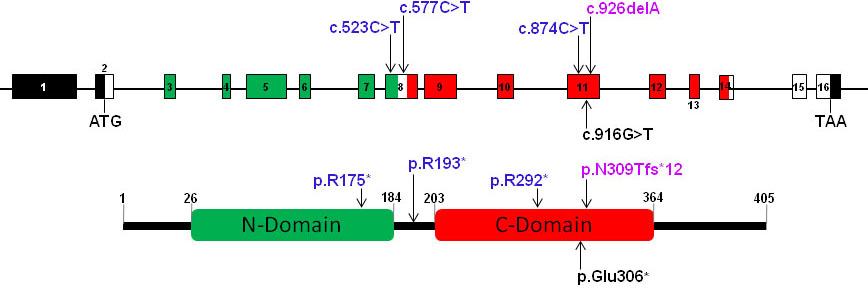
 Figure 4 of
Waheed, Mol Vis 2012; 18:1253-1259.
Figure 4 of
Waheed, Mol Vis 2012; 18:1253-1259.