Figure 7. Autofluorescence of
macrophage and microglial cells after 4 day feeding with
different preparations A: FACS analysis in FITC channel
(detection filter wavelength, 533/30 nm) of the microglial cells
and macrophage cells fed with different preparations. B:
FACS analysis in PE channel (detection filter wavelength, 585/40
nm) of the microglial cells and macrophage cells fed with
different preparations. Note the LLAF increase in cells fed with
retinoids, especially the increase observed after feeding with
11-cis-retinal at 585 nm compared to that at 533 nm.
Abbreviation key: ATRS=all-trans-retinal; 9-cis=9-cis
retinal; 11-cis=11-cis-retinal; Lipo=liposome preparation. Each
bar reflects the average value obtained from three samples.
Asterisks indicate statistical significance (one sample t-test;
* p<0.05, ** p<0.01).
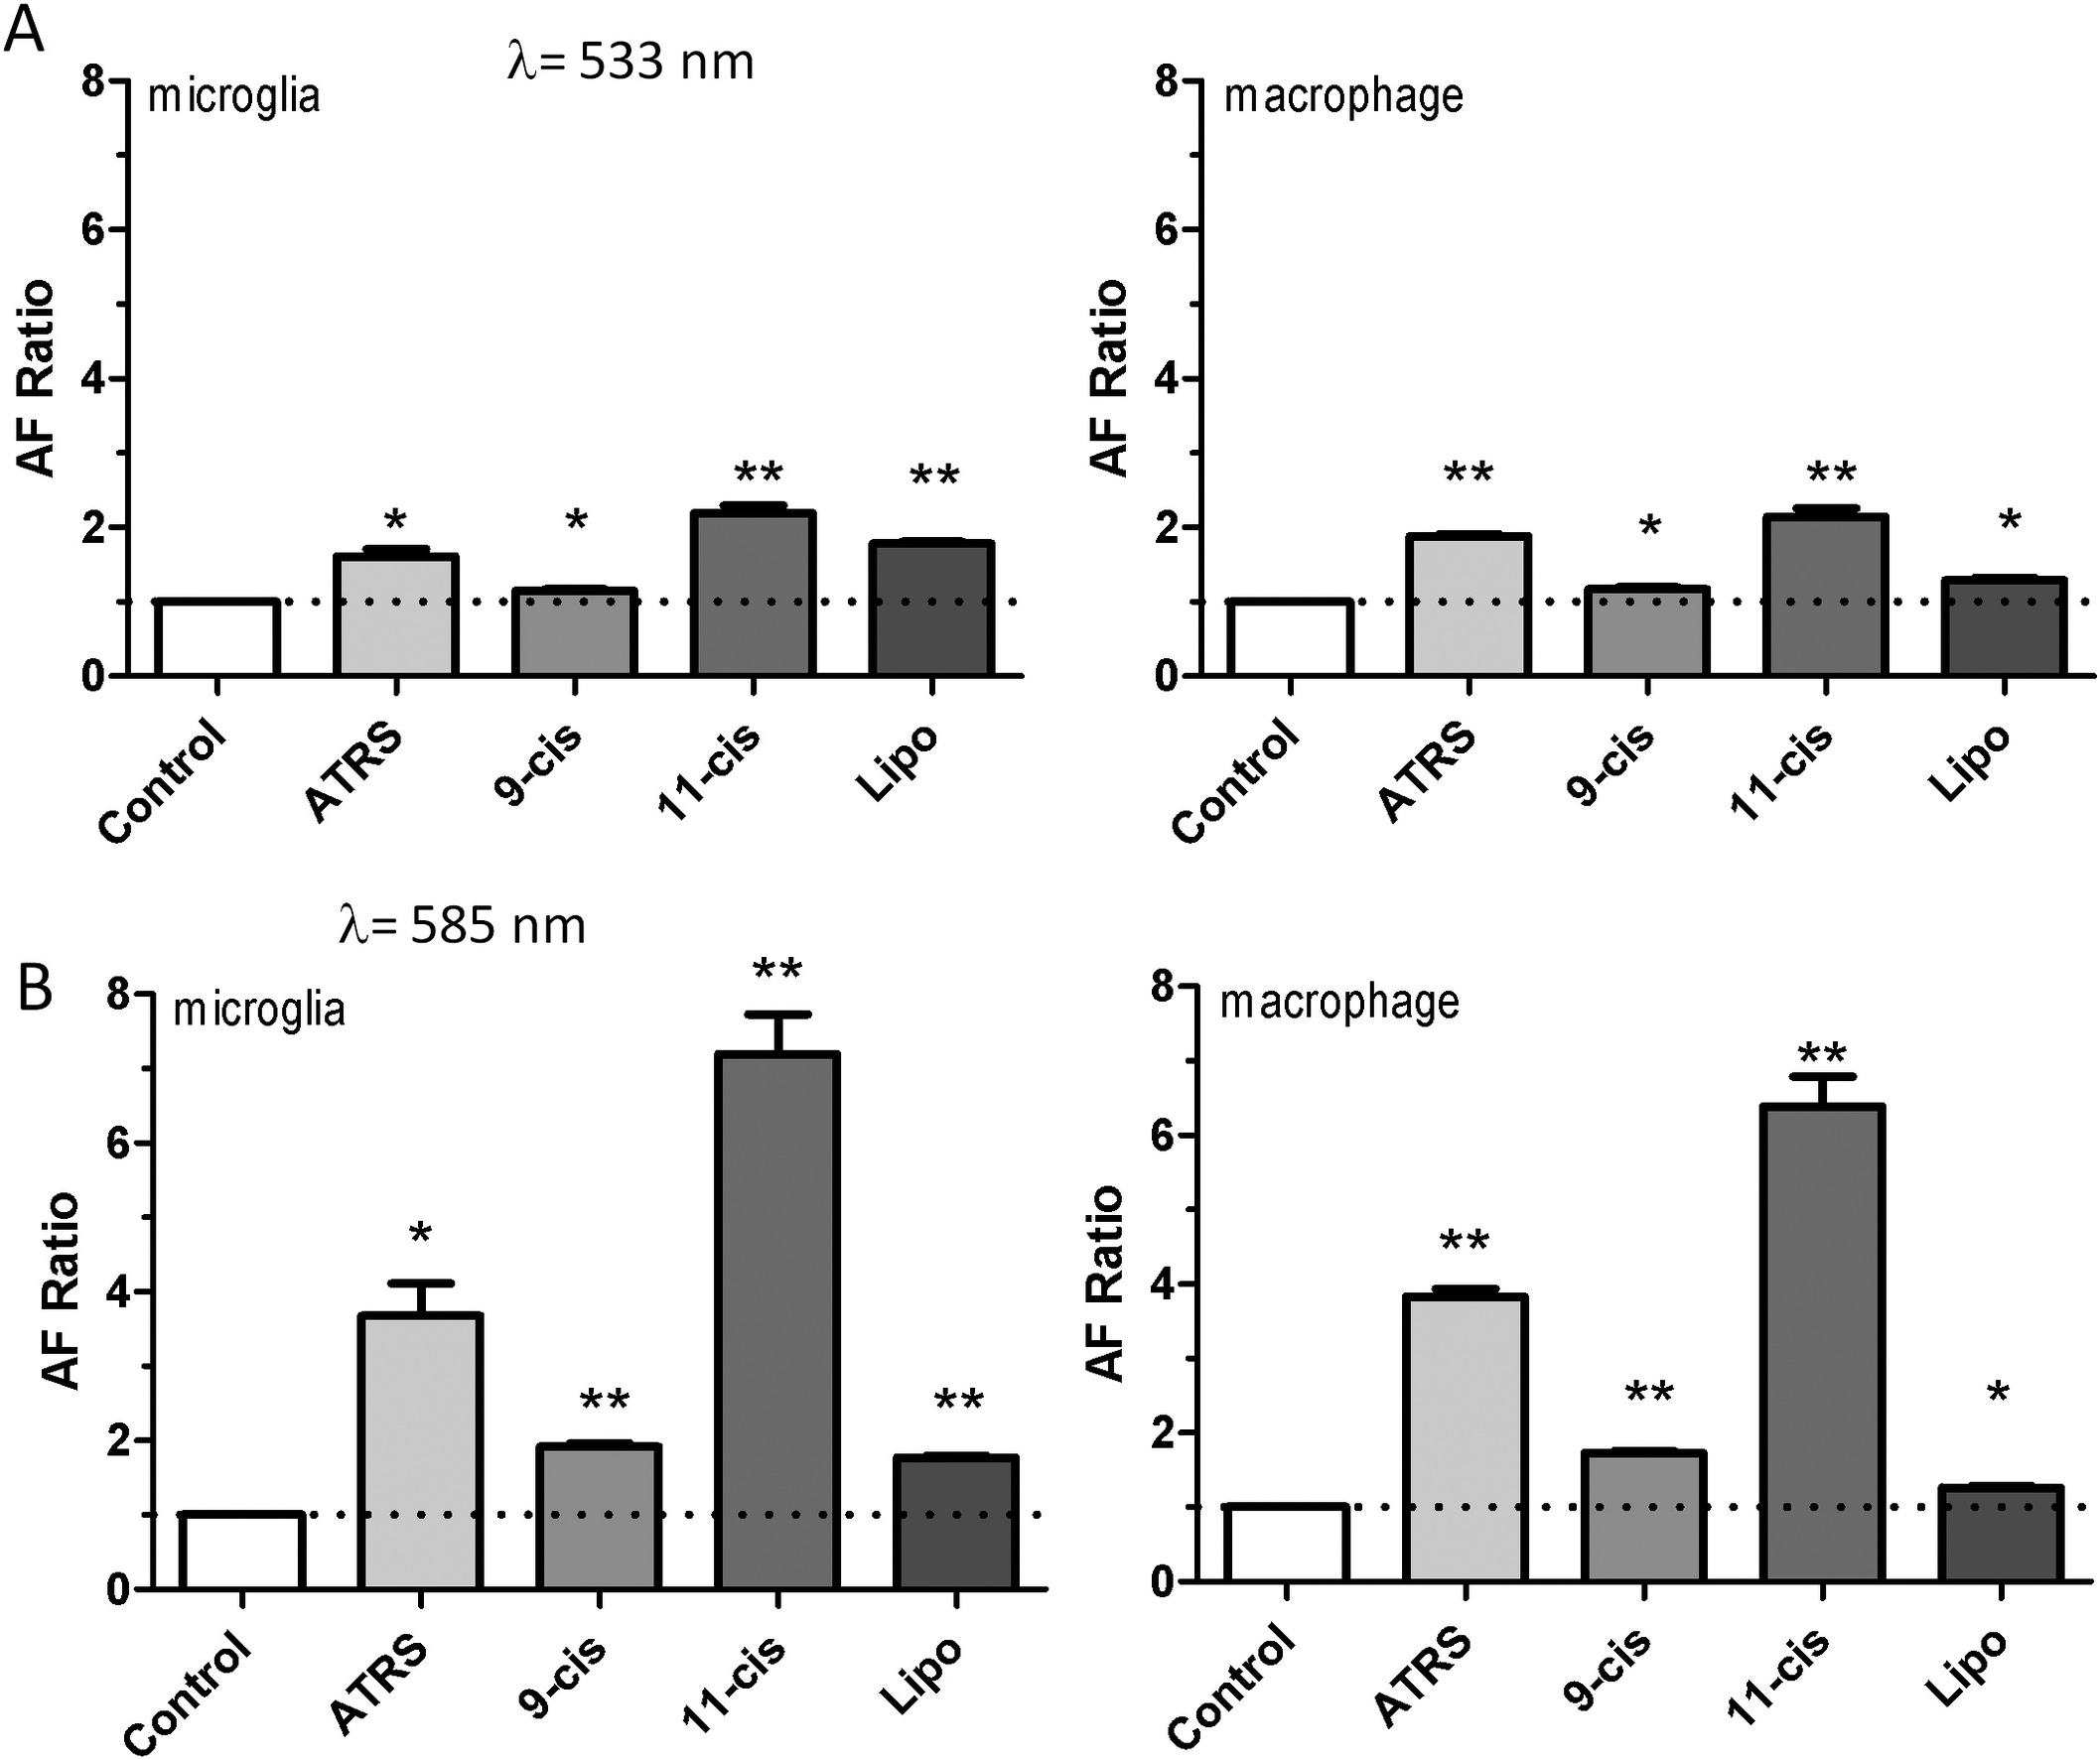
 Figure 7
of Lei, Mol Vis 2012; 18:103-113.
Figure 7
of Lei, Mol Vis 2012; 18:103-113.