Figure 6. TβRII siRNA blocks
SRA01/04 cells migration. Inverted microscope images
demonstrating migration of HLECs (A), cells treated for
48 h with scrambled siRNA (B), or cells treated for 48 h
with 80 nM hT3 (C). Black straight lines mark the wound
edges. D: Bar graph showing mean cell numbers migrating
to wound area in each specimen (n=10); error bars represent the
standard error of the mean. Asterisks denote values
significantly different from those of scrambled siRNA treated
controls (p<0.0001). Experiments were repeated 3 times,
yielding similar results. The bar represents 25 μm.
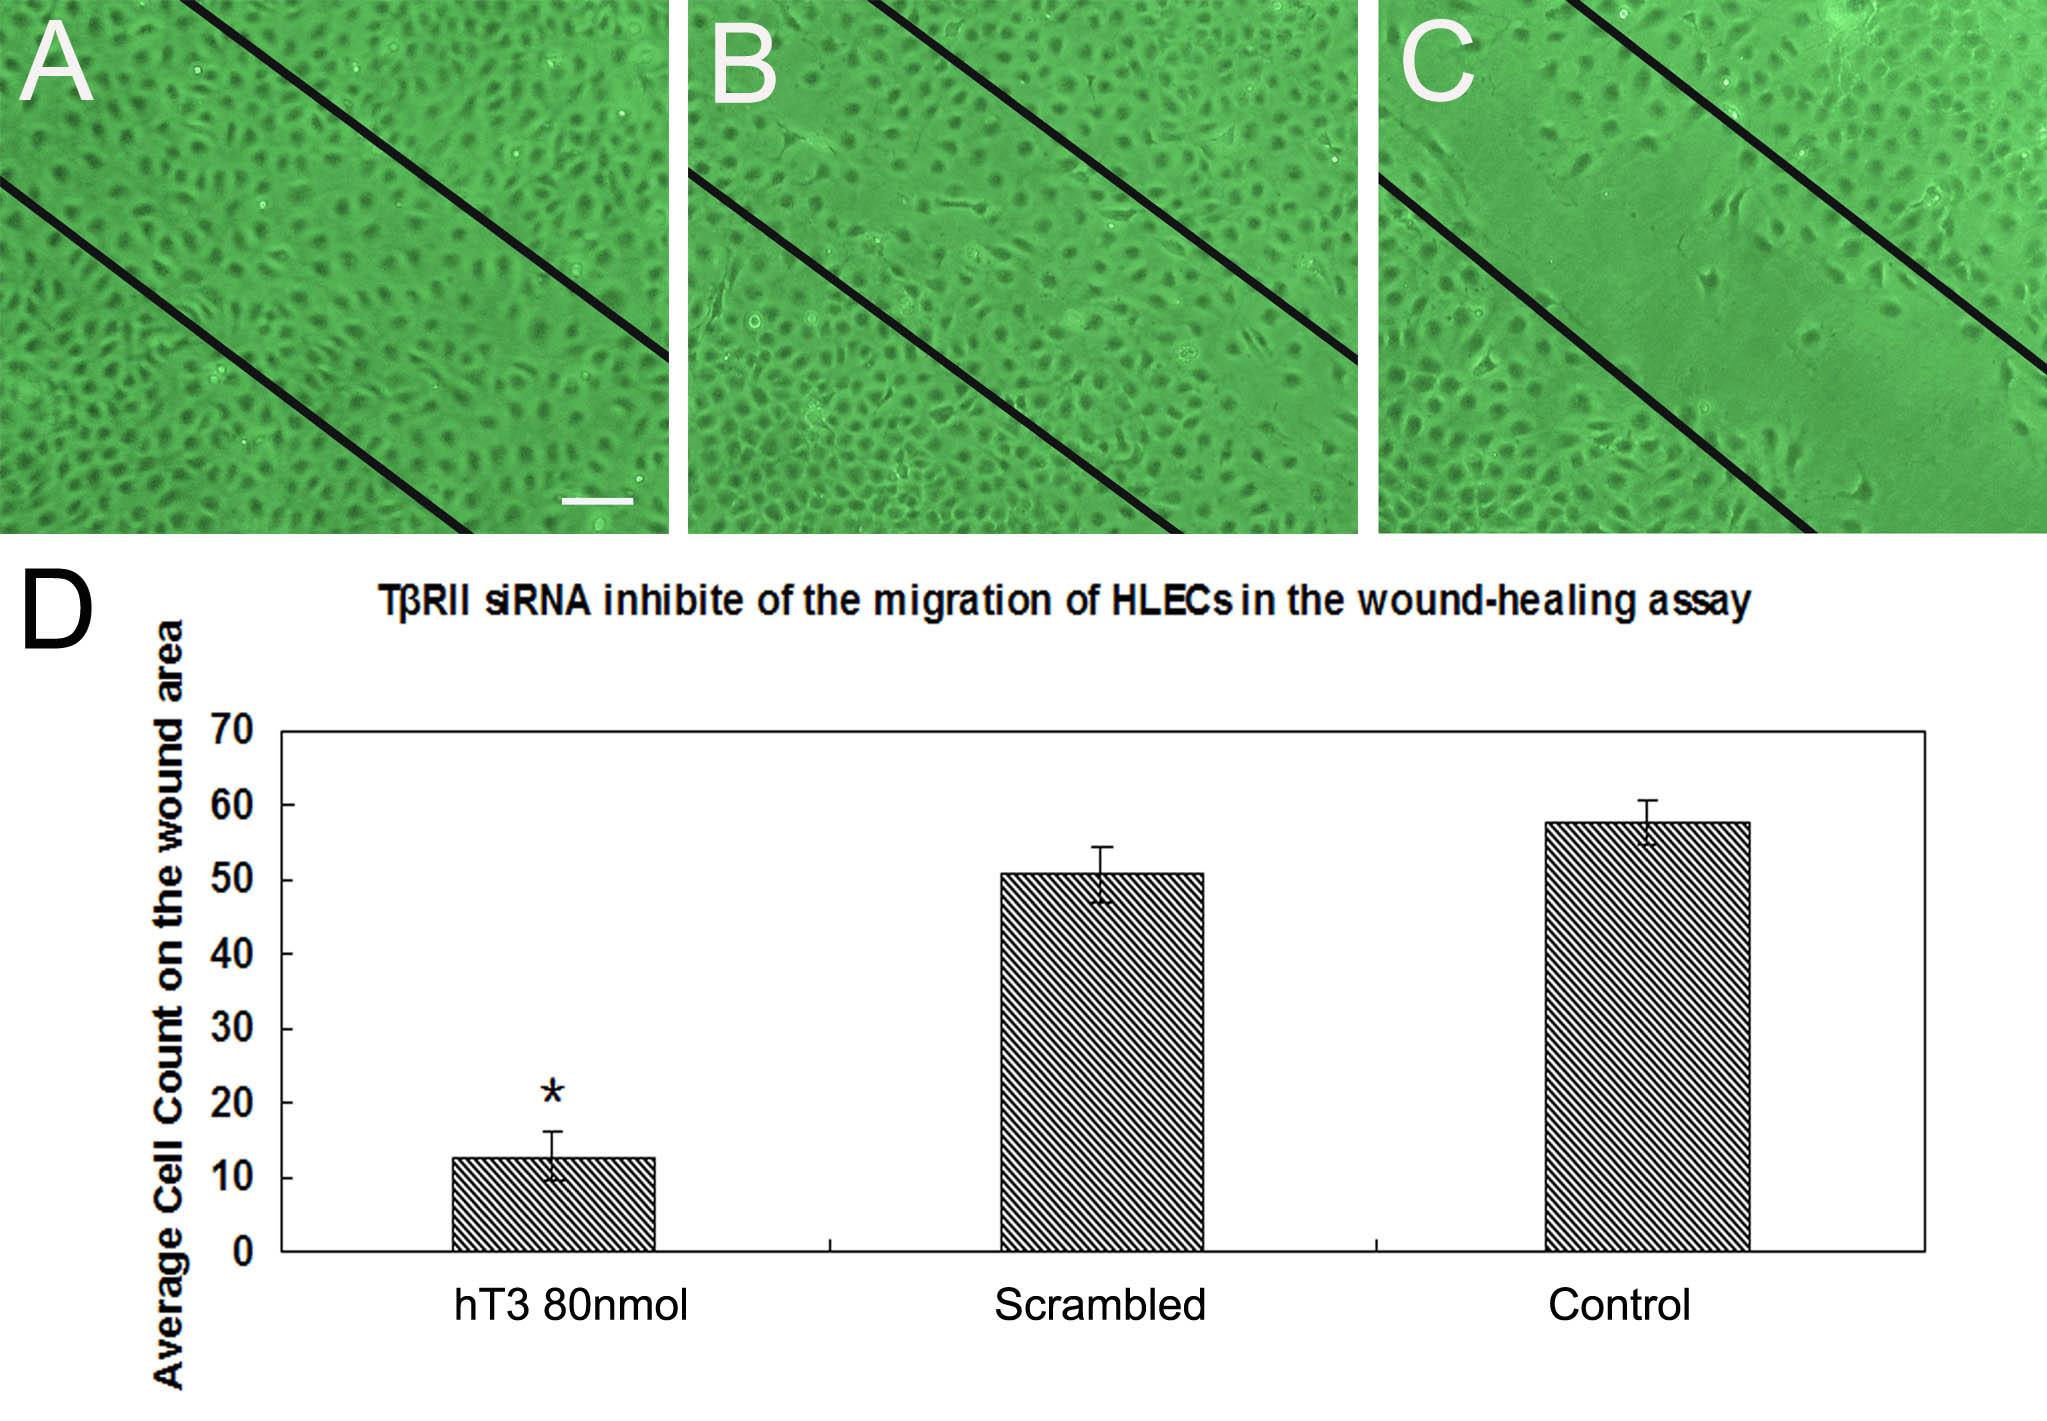
 Figure 6
of Zheng, Mol Vis 2012; 18:1238-1246.
Figure 6
of Zheng, Mol Vis 2012; 18:1238-1246.