Figure 2. Quantitative analysis of
optimal transfection of different concentration of Cy3-labeled
scrambled siRNA for SRA01/04 cells. The Cy3-labeled scrambled
siRNA transfection rates of SRA01/04 cells after incubating for
6 h were evaluated by flow cytometry. A: Blank group:
0%. B: 60 nM Cy3-labeled scrambled siRNA: 0.8%. C:
80 nM Cy3-labeled scrambled siRNA: 49.6%. D: 100 nM
Cy3-labeled scrambled siRNA: 8.8%.
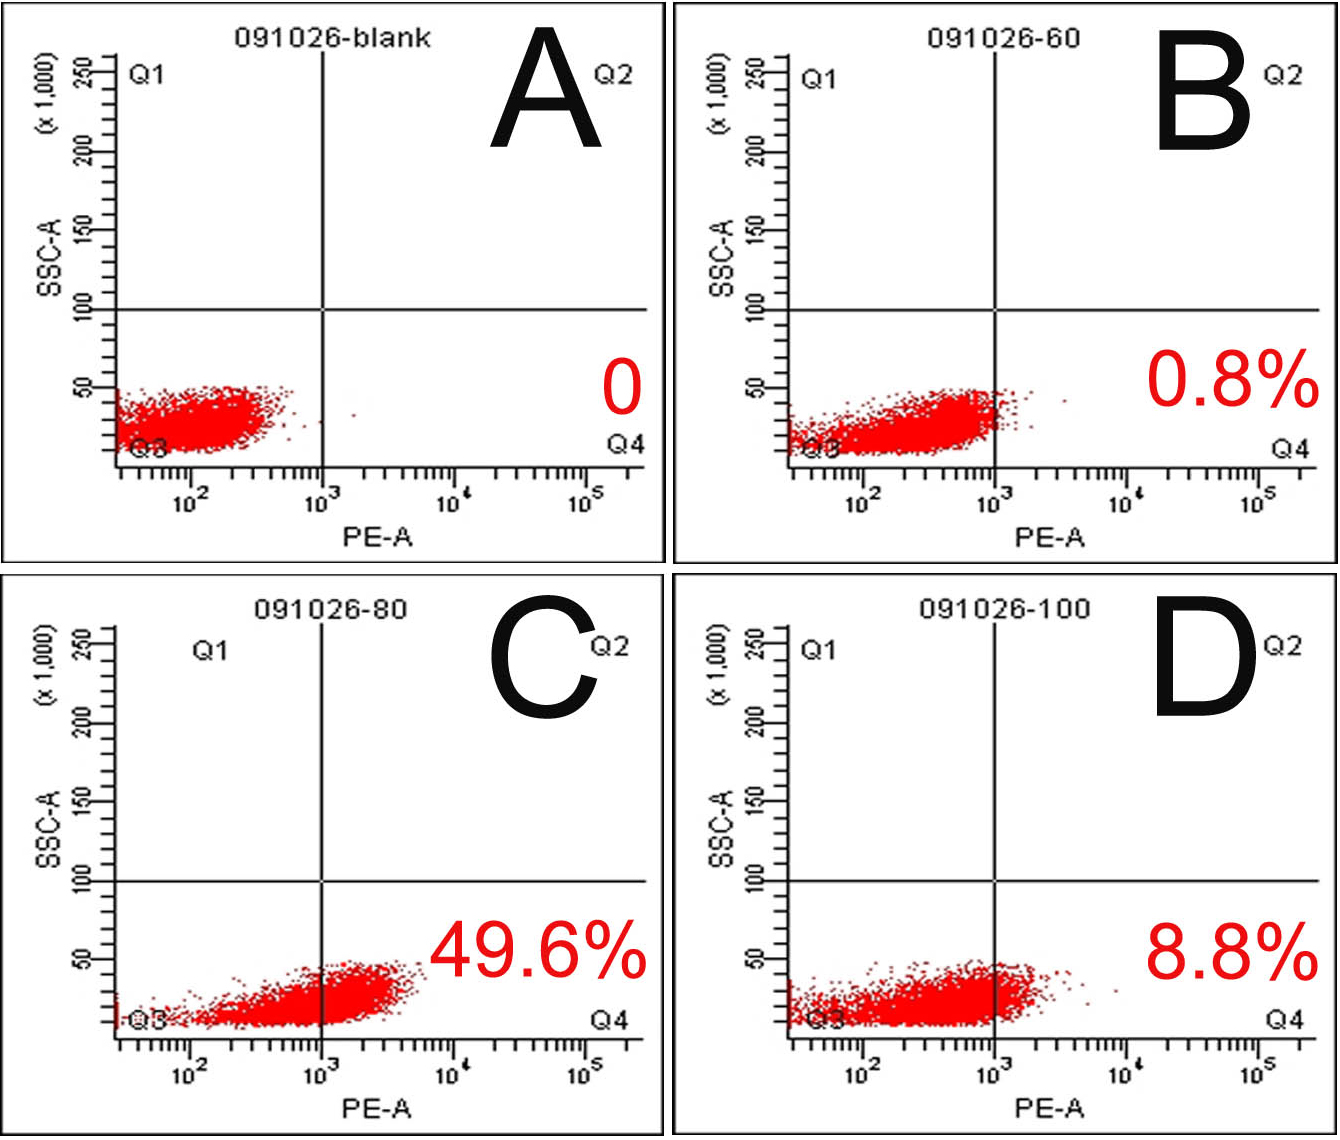
 Figure 2
of Zheng, Mol Vis 2012; 18:1238-1246.
Figure 2
of Zheng, Mol Vis 2012; 18:1238-1246.