Figure 1. Qualitative analysis of
optimal transfection of different concentration of Cy3-labeled
scrambled siRNA for SRA01/04 cells. Distribution of Cy3-labeled
scrambled siRNA (red fluorescence) in SRA01/04 cells at 6 h
after scrambled siRNA transfection with a final concentration
gradient of 20 (A), 40 (B), 50 (C), 60 (D),
or 80 nM (E). Cells incubated with Lipofectamine™ 2000
reagent alone (no siRNA) served as blank control which did not
show fluorescence appearance (F). Bar: 25 μm.
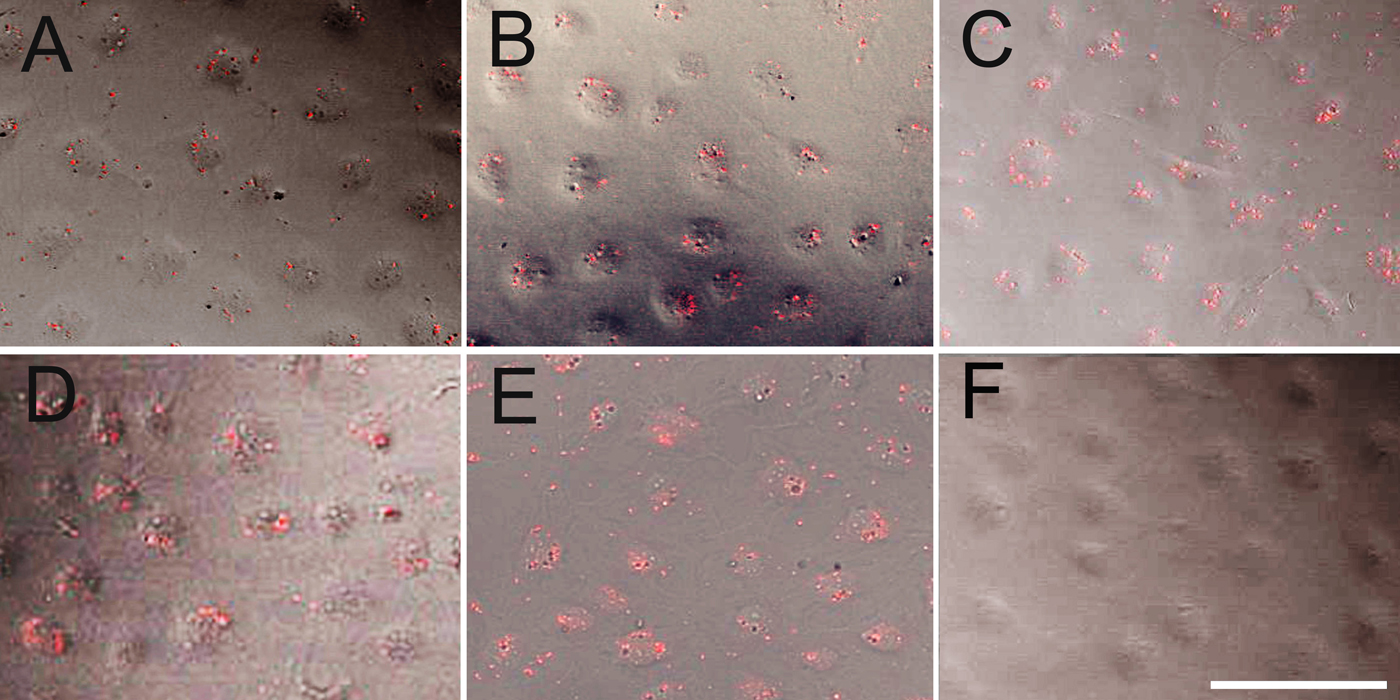
 Figure 1
of Zheng, Mol Vis 2012; 18:1238-1246.
Figure 1
of Zheng, Mol Vis 2012; 18:1238-1246.