Figure 6. Gliosis–transcriptional
profiles of genes associated with Emg1. All the top hits
for genes coregulated with Emg1 are shown in a heatmap.
Signals from the Affymetrix chip have been scaled such that
bright red represents >10,000, and black <1,000, varying
shades of red the values in between.
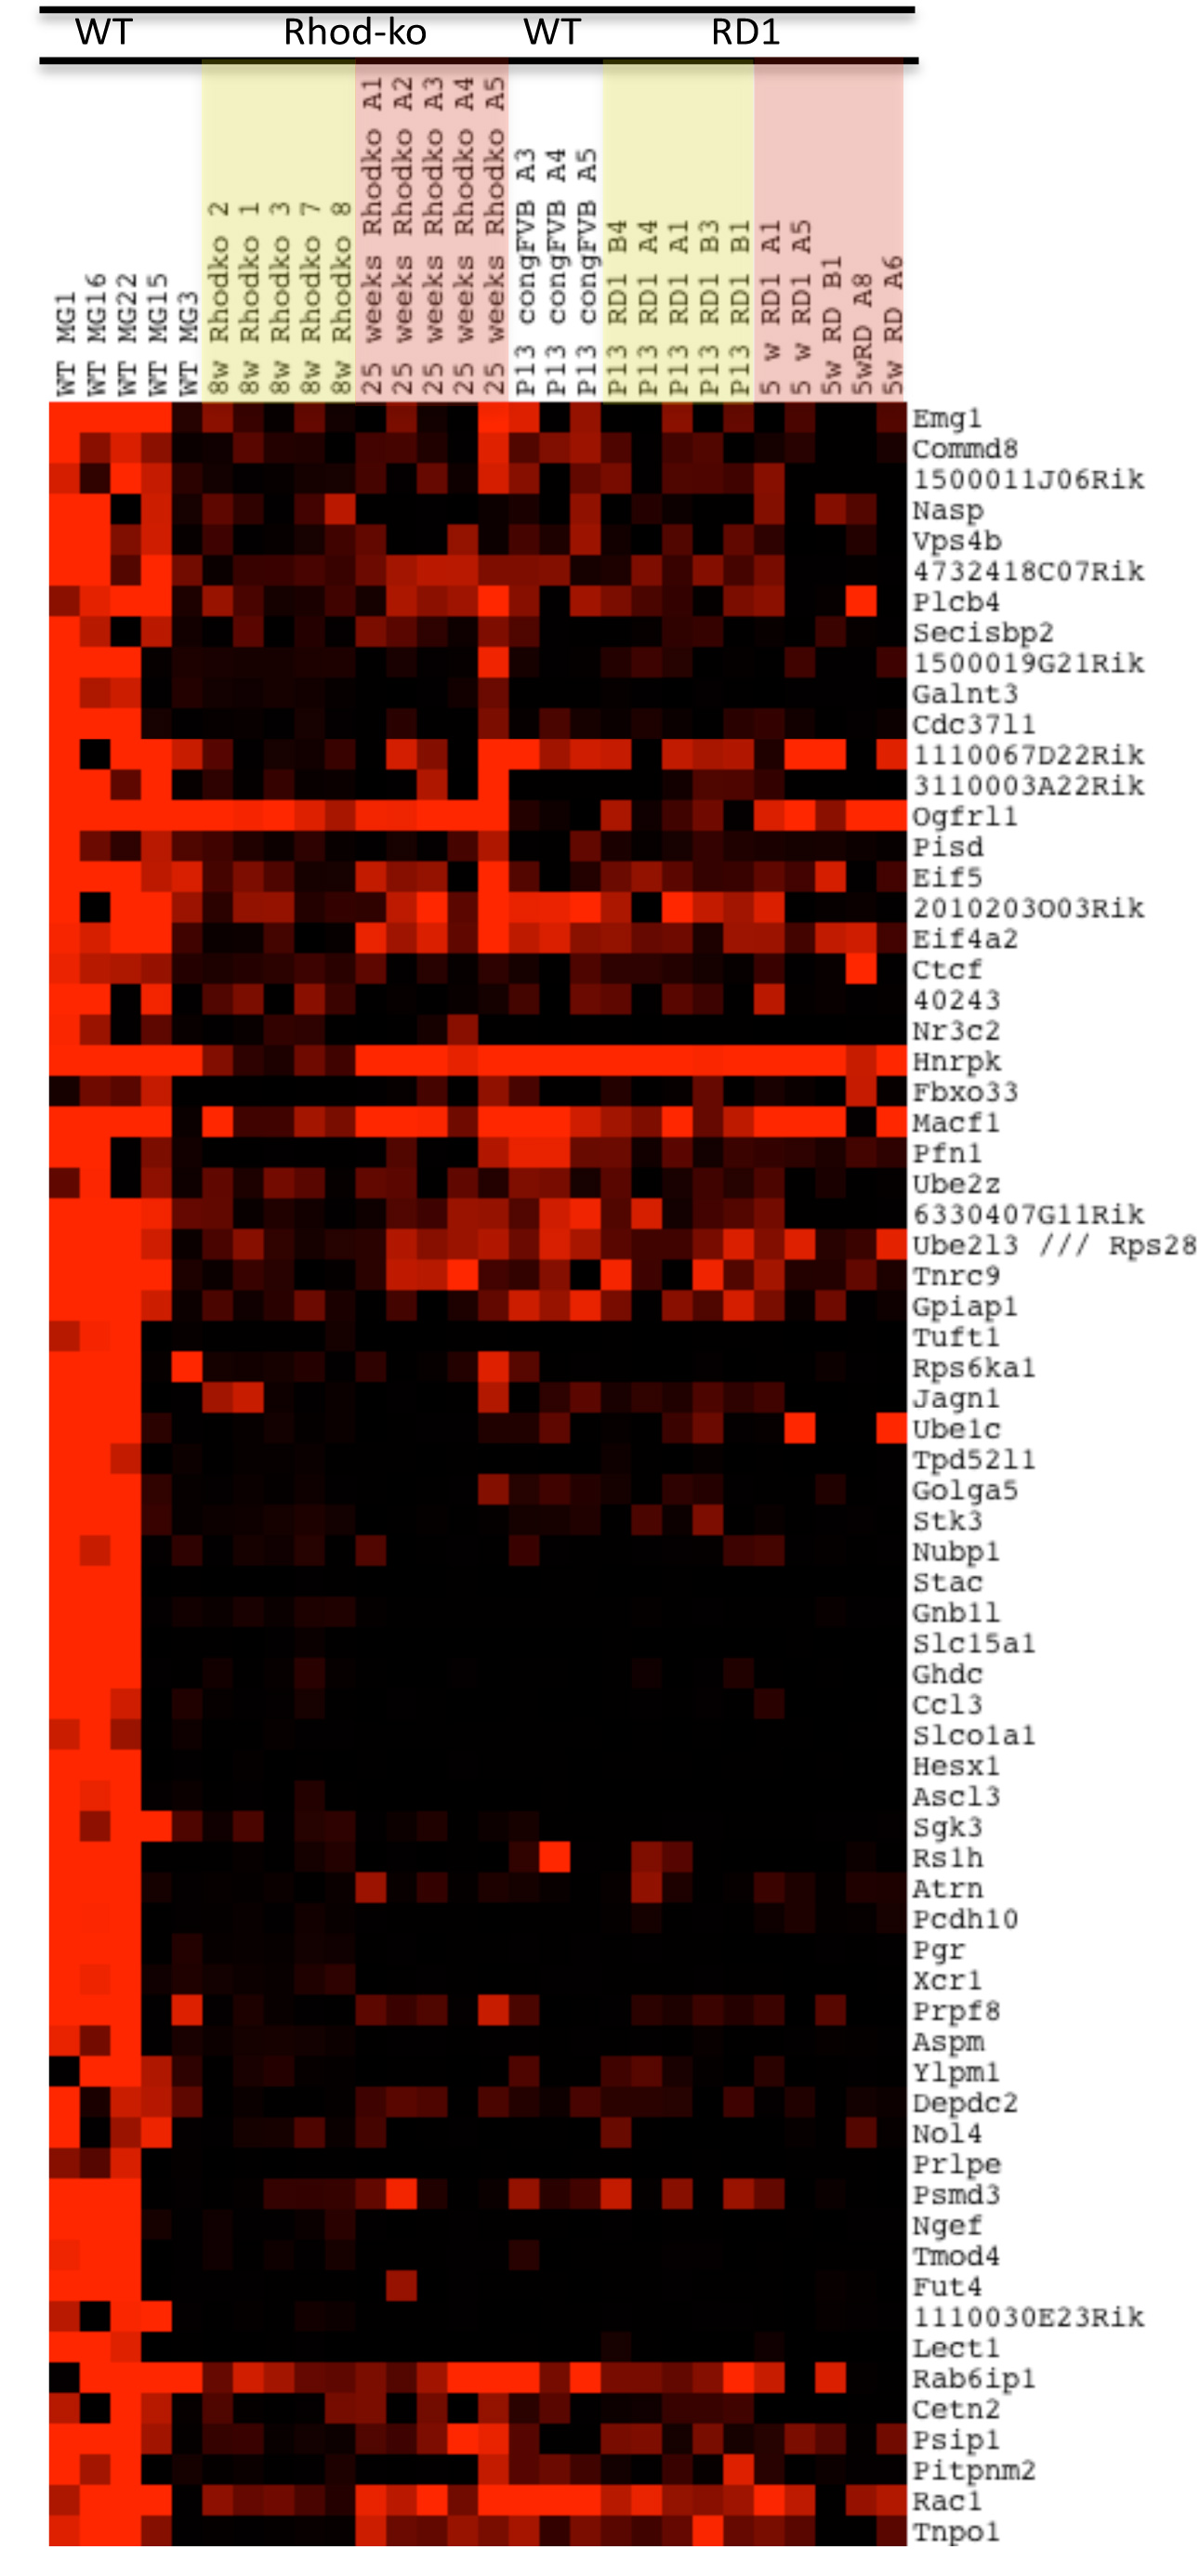
 Figure 6
of Roesch, Mol Vis 2012; 18:1197-1214.
Figure 6
of Roesch, Mol Vis 2012; 18:1197-1214.