Figure 5. Gliosis–regenerative
potential. A heatmap created in Java TreeView shows the
expression of a selection of genes common to regeneration across
MGCs. Signals from the Affymetrix chip have been scaled such
that bright red represents >10,000, and black <1,000,
varying shades of red the values in between.
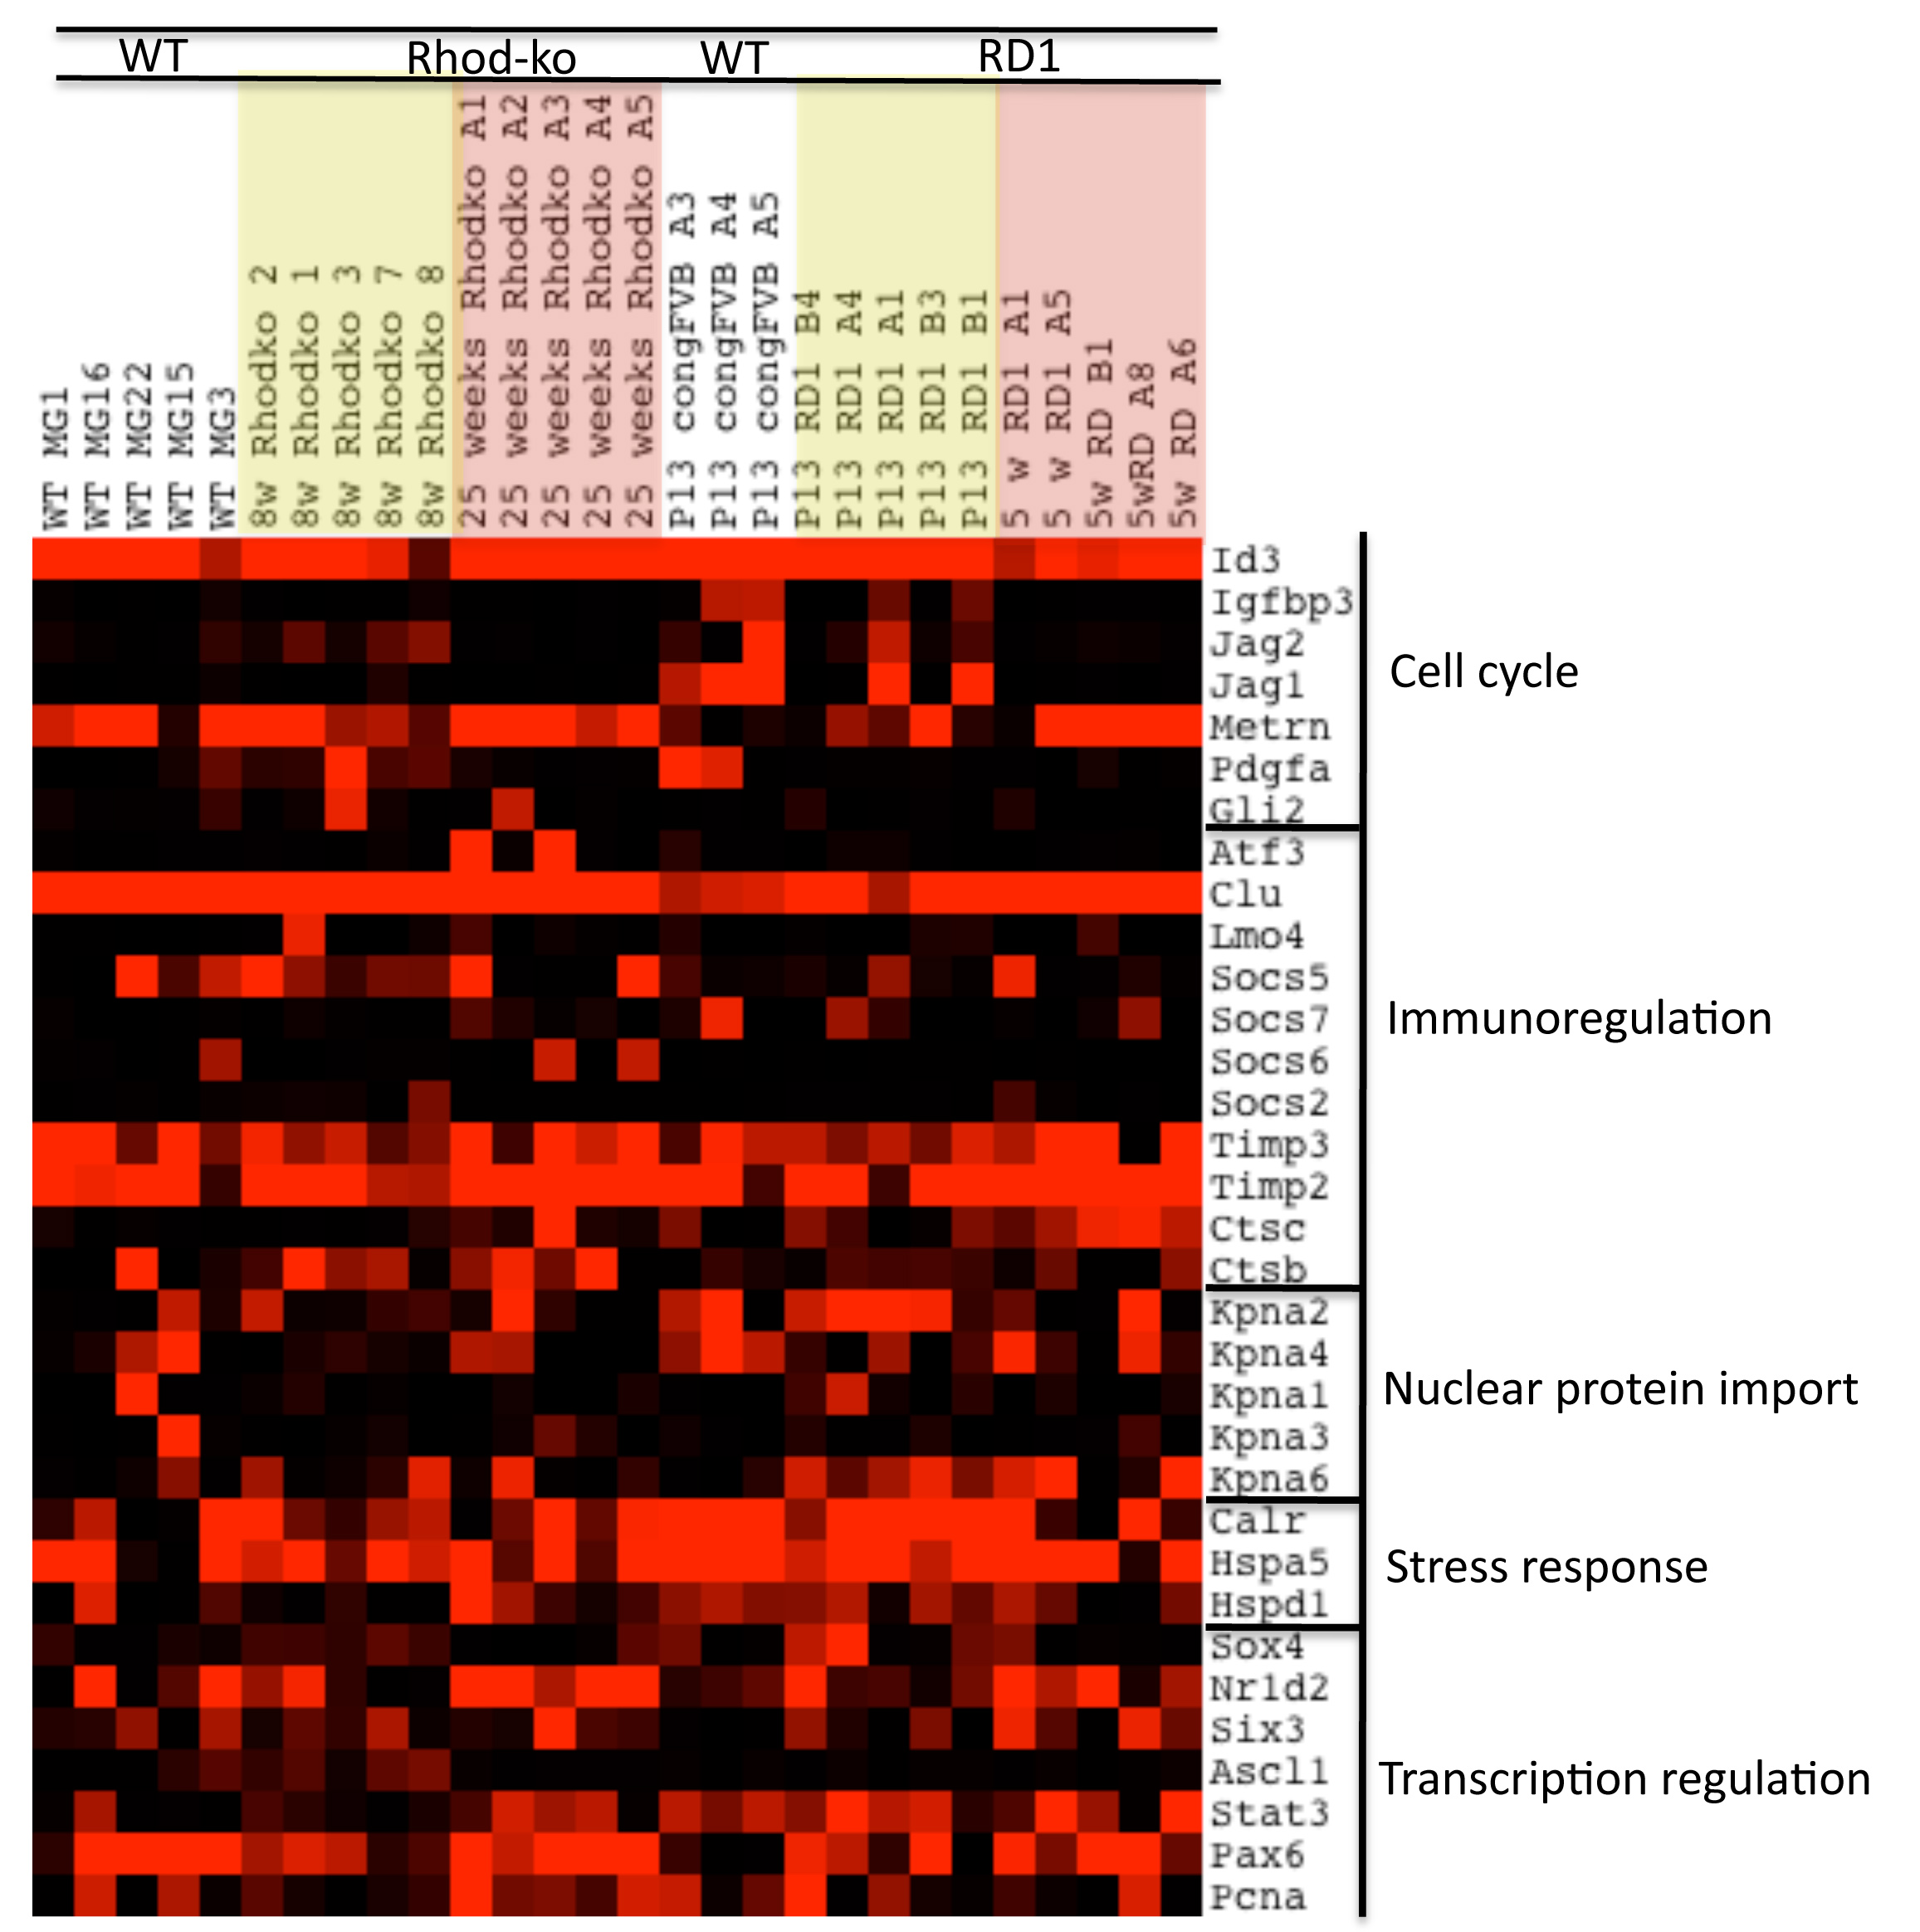
 Figure 5
of Roesch, Mol Vis 2012; 18:1197-1214.
Figure 5
of Roesch, Mol Vis 2012; 18:1197-1214.