Figure 3. Gliosis-cell cycle reentry
and proliferation. A Java TreeView-generated heatmap
illustrating the expression of genes involved in control of the
cell cycle and proliferation. Signals from the Affymetrix chip
have been scaled such that bright red represents >10,000, and
black <1,000, varying shades of red the values in between.
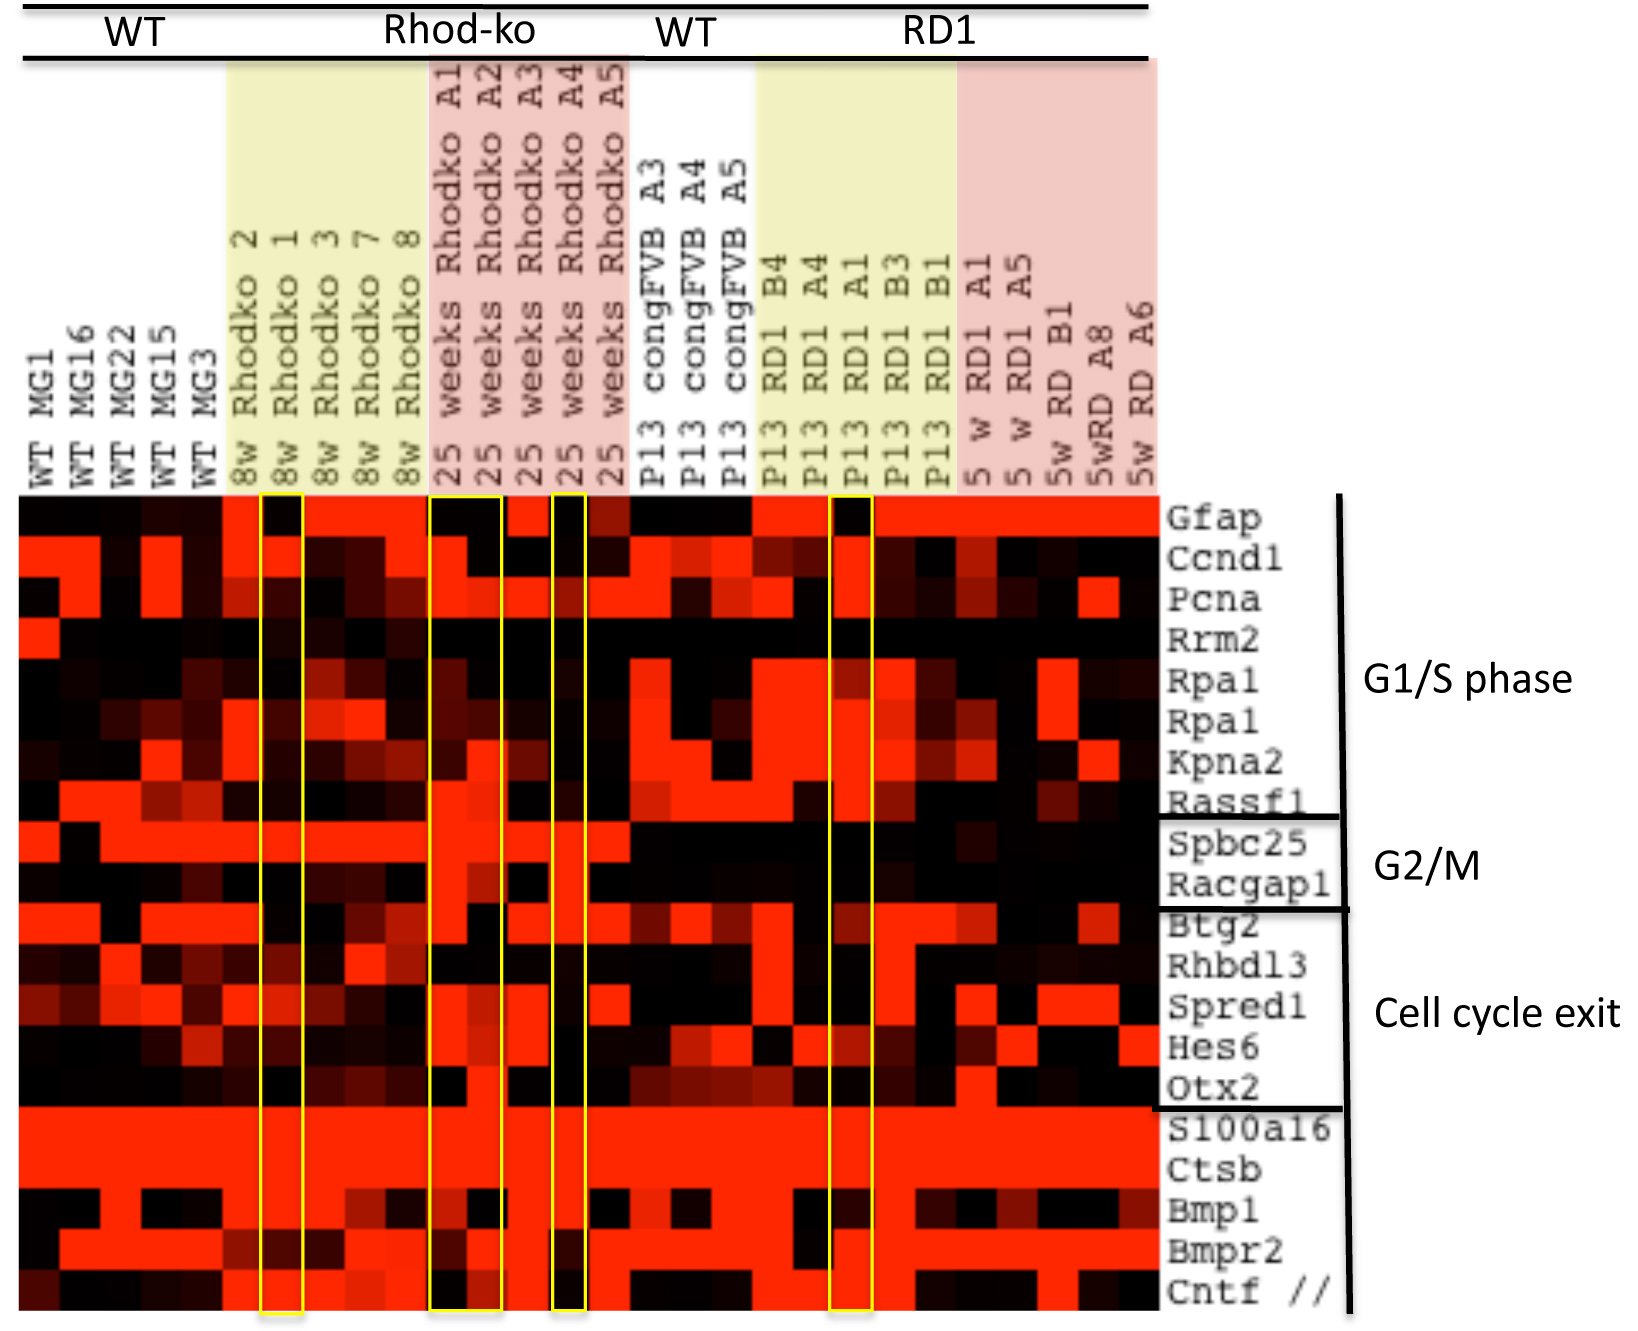
 Figure 3
of Roesch, Mol Vis 2012; 18:1197-1214.
Figure 3
of Roesch, Mol Vis 2012; 18:1197-1214.