Figure 2. Key features of gliosis. A
subset of genes with significant p values (<0.01) compared
with Gfap expression were distributed into functional
groups. Signals from the Affymetrix chip have been scaled such
that bright red represents >10,000, and black <1,000,
varying shades of red the values in between.
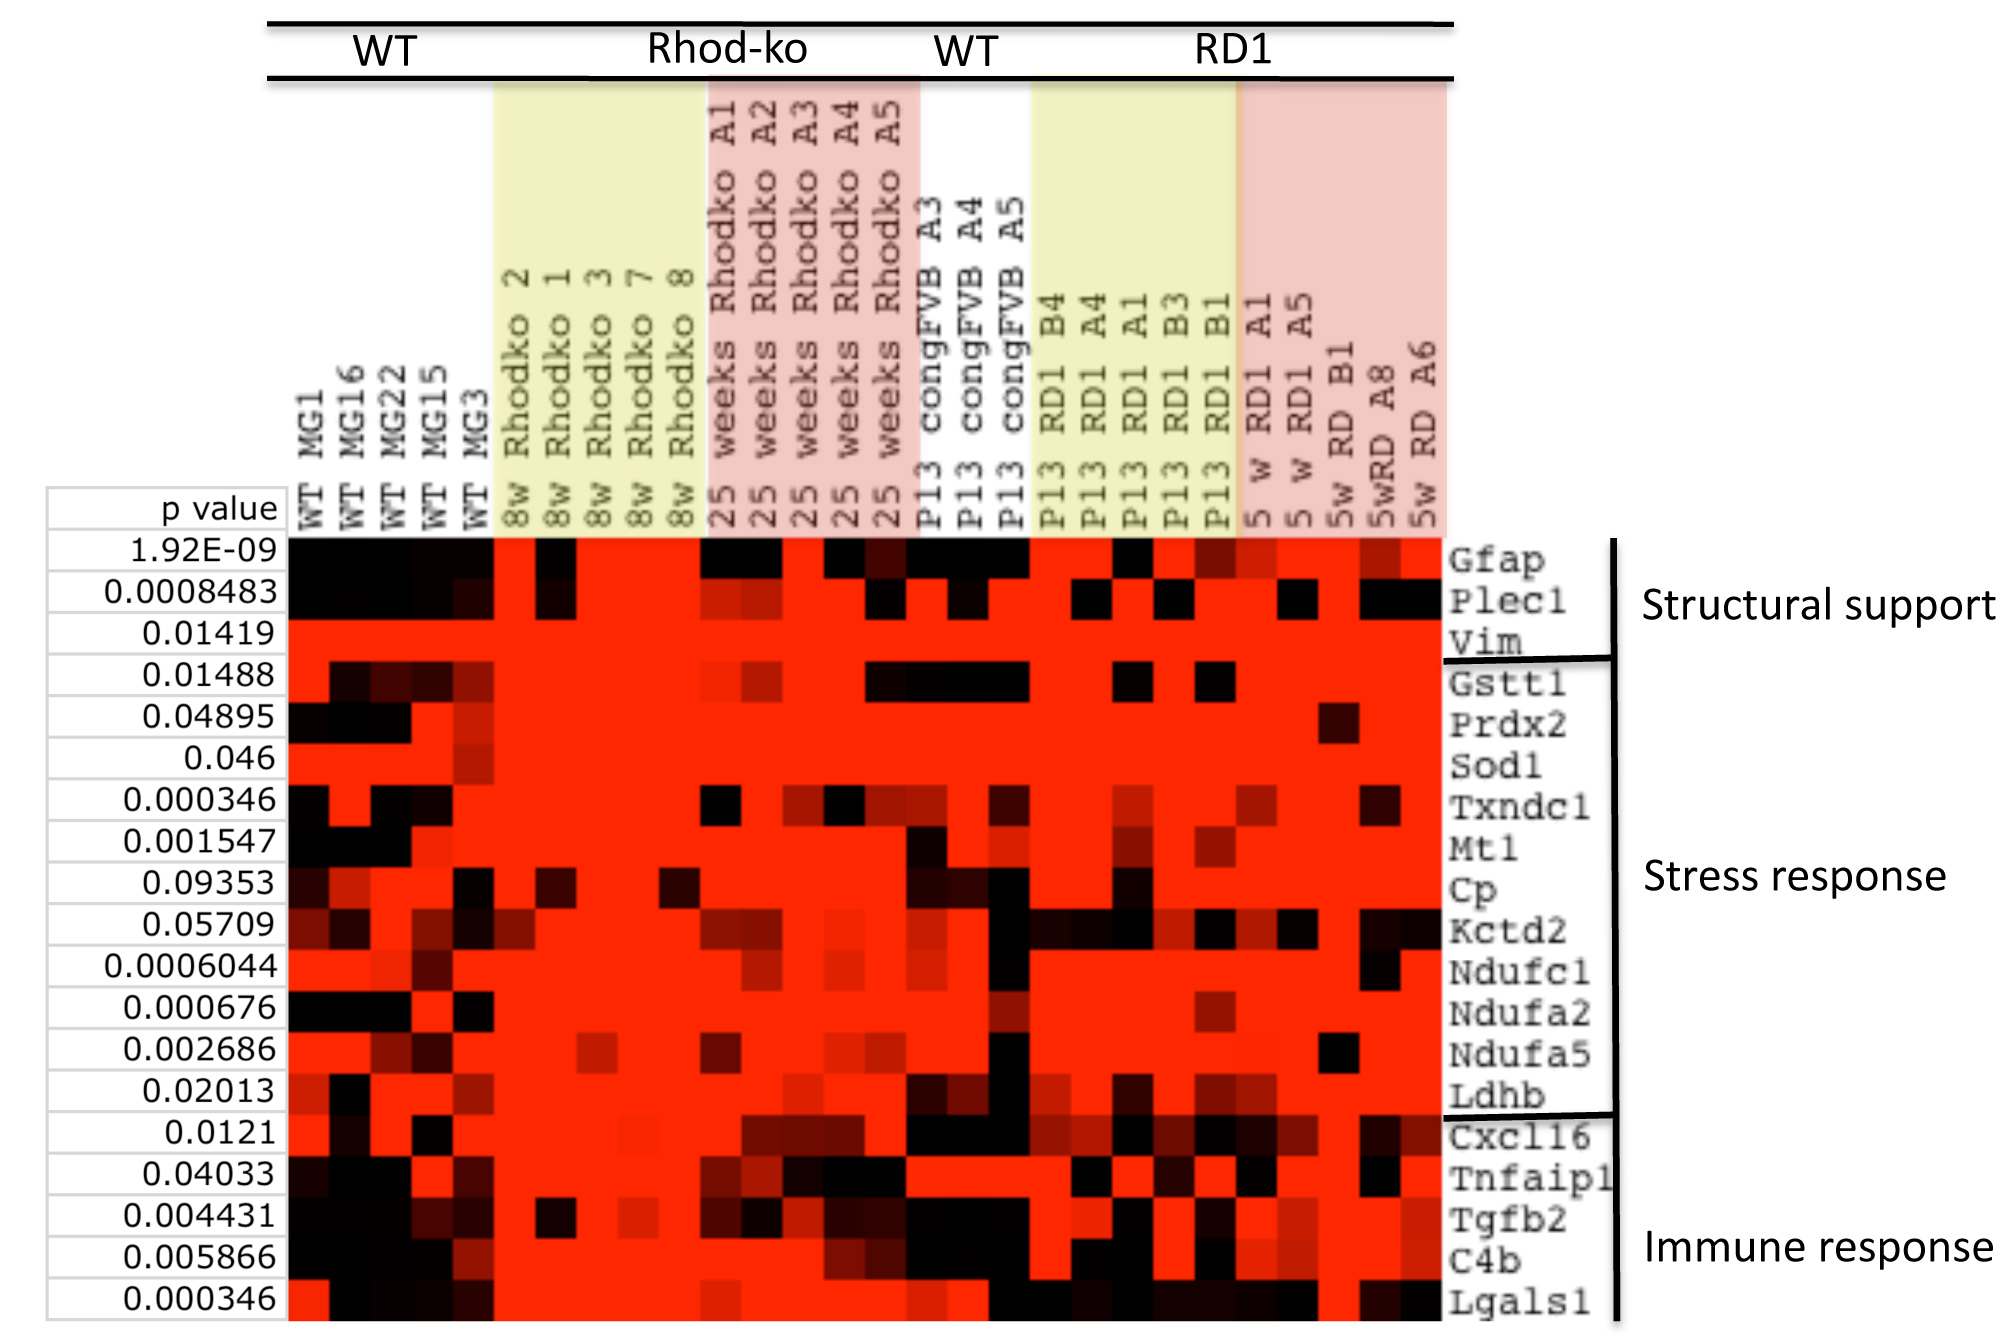
 Figure 2
of Roesch, Mol Vis 2012; 18:1197-1214.
Figure 2
of Roesch, Mol Vis 2012; 18:1197-1214.