Figure 1. Single cell transcriptional
profiles of genes highly associated with Gfap. Single
MGCs were picked from dissociated retinas from two strains of
degenerating retinas and from WT retinas. Single cell RNAs were
reverse transcribed, amplified with PCR, and applied to
Affymetrix microarrays. Columns represent the signal from single
cell samples, rows represent genes. A heatmap was generated in
TreeView such that bright red represents >10,000, and black
<1,000, varying shades of red the values in between. A
Fisher’s exact test was run to find genes that were coregulated
with Gfap (Affymetrix identifier X1426508_at). All the
top hits for genes coregulated with Gfap and their
corresponding p values are shown. MGC samples: WT=wild-type,
Rhod-ko=Rhodopsin knockout model, rd1=phosphodiesterase beta 1
rd1 mutant on the FVB strain background, and cong FVB is a WT
control for rd1 on a congenic FVB background. Time points chosen
are >21 days for WT, and 8 weeks and 25 weeks for the peaks
of the two cell death waves in the Rhod-ko model. The
corresponding time points in the rd1 are postnatal day P13 and 5
weeks. MGCs from congenic FVB at P13 were profiled as WT samples
that are better age matched to the early cell death wave in the
rd1 model.
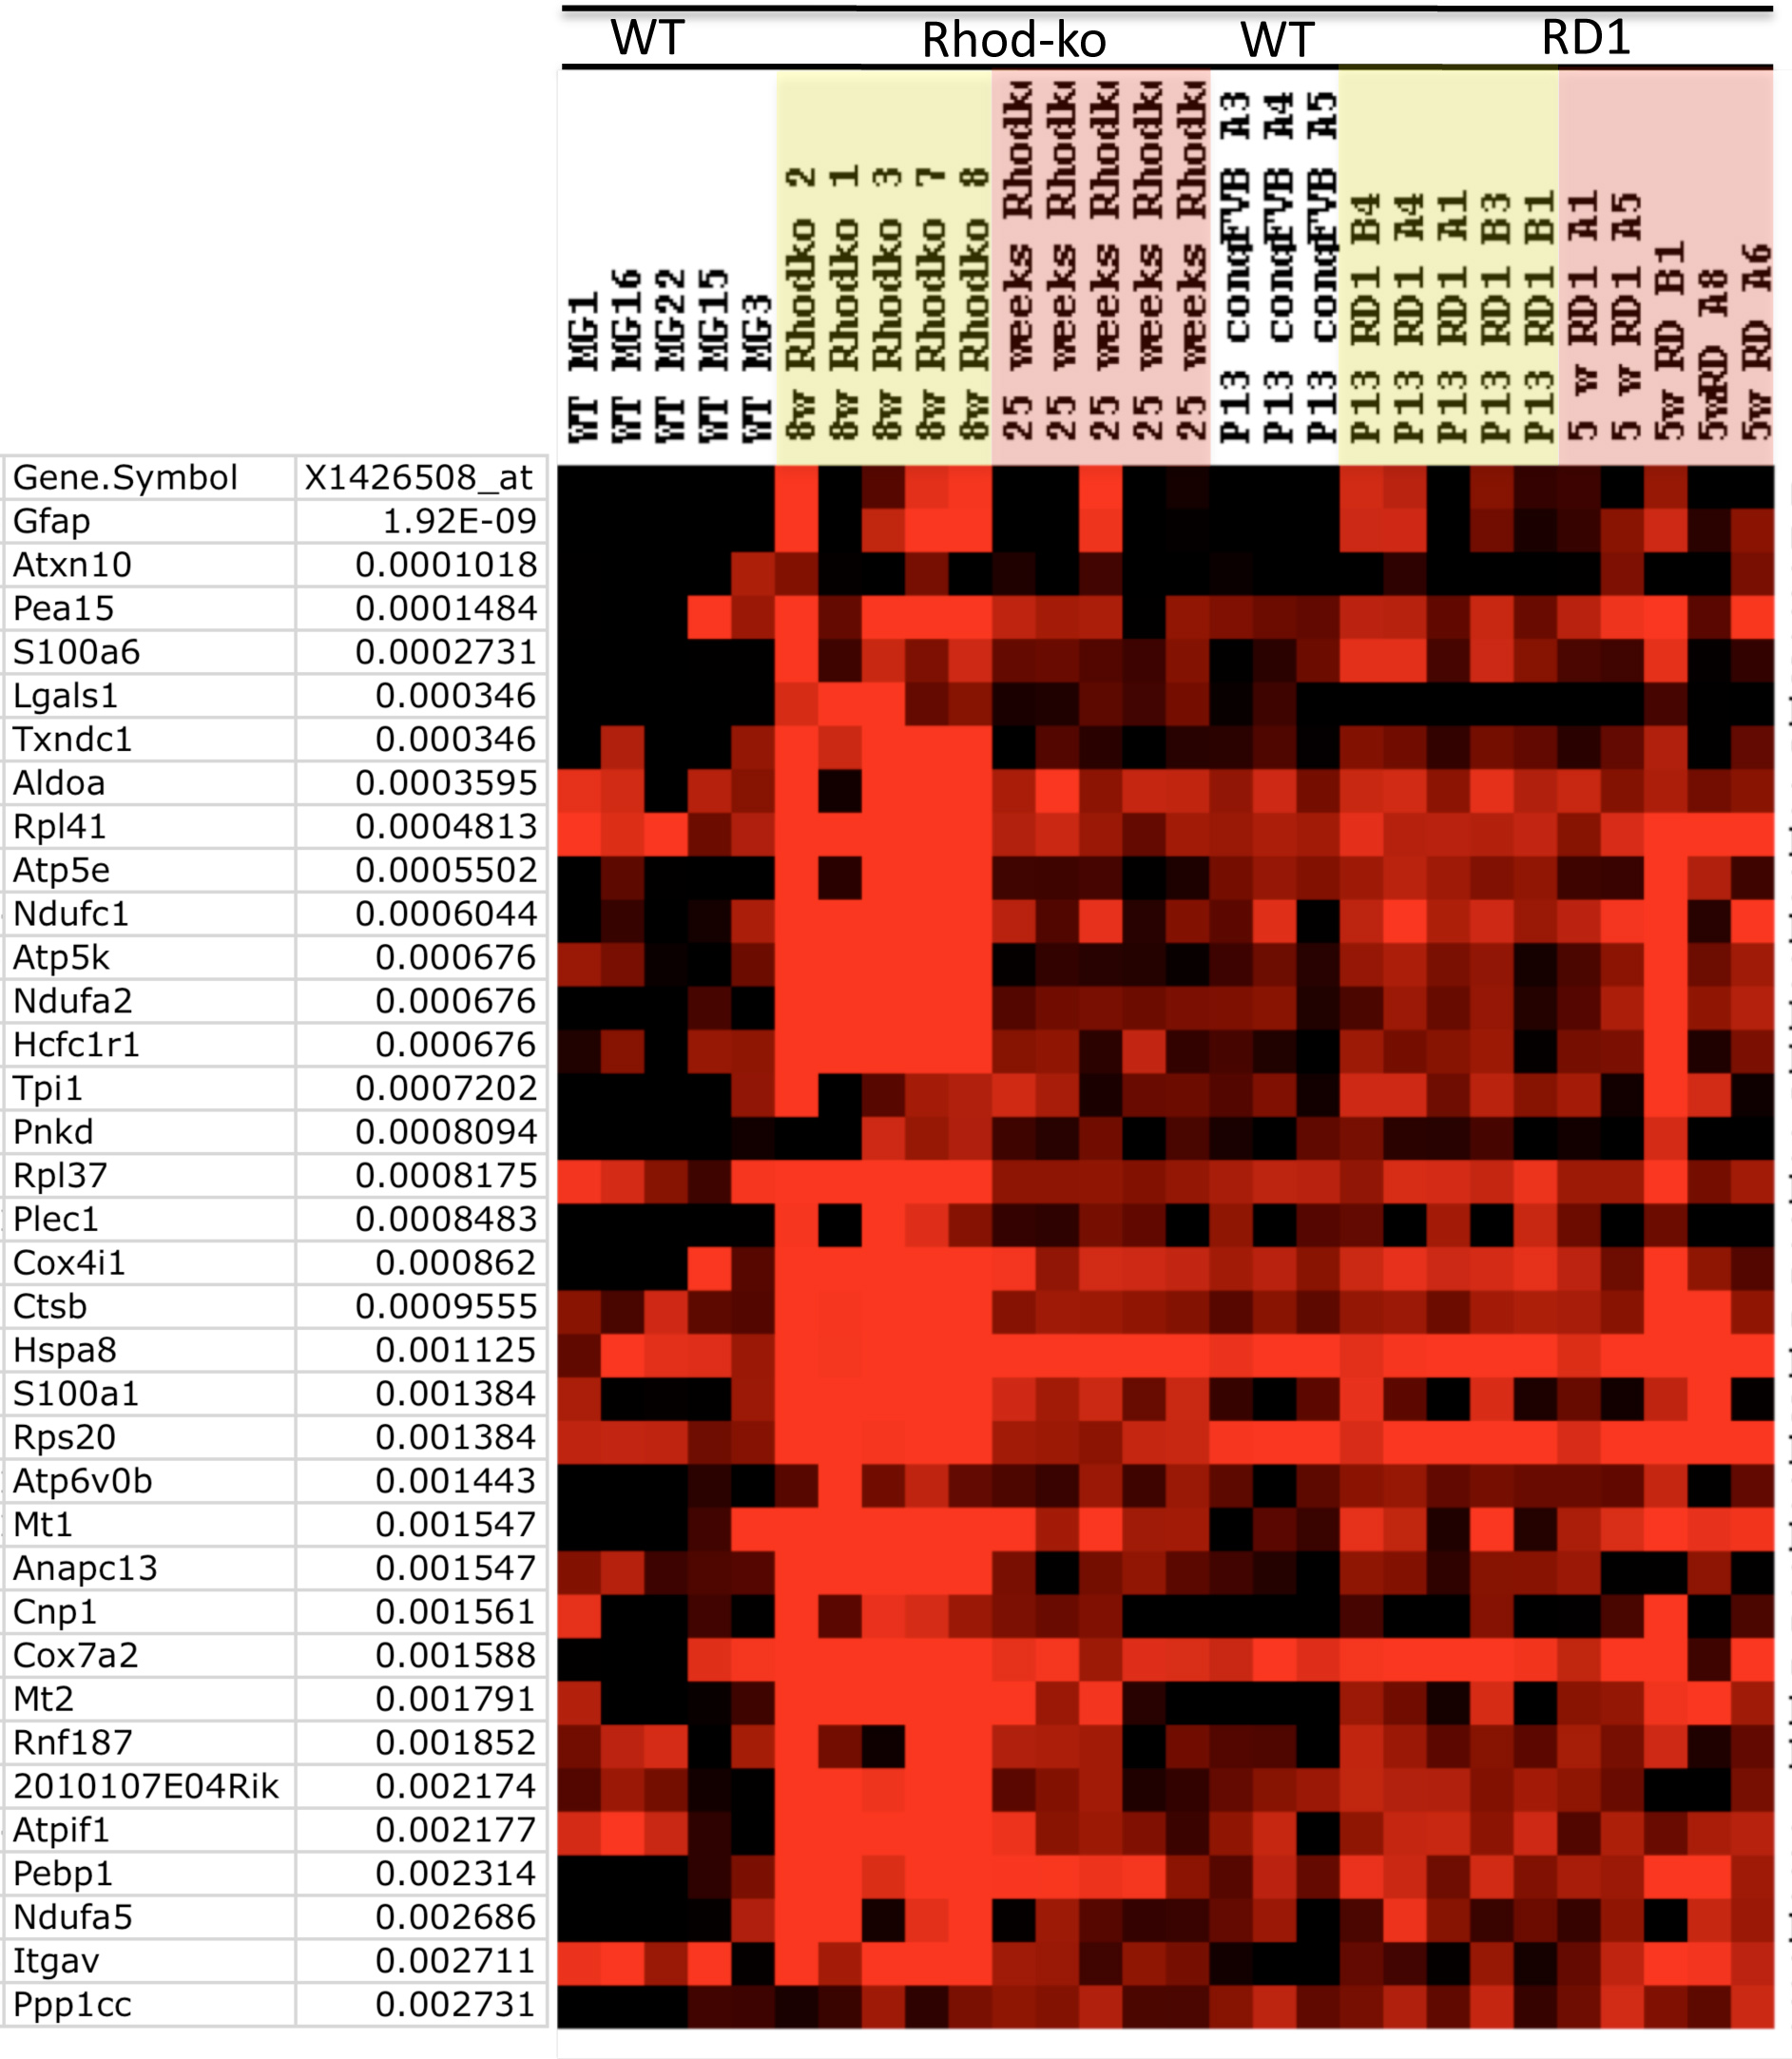
 Figure 1
of Roesch, Mol Vis 2012; 18:1197-1214.
Figure 1
of Roesch, Mol Vis 2012; 18:1197-1214.