Figure 4. Interleukin-6 secretion
from HCE-2 cells analyzed by ELISA. Columns represent the amount
of IL-6 pg/ml (mean±SD). One-Way ANOVA, followed by Dunnett’s
post hoc test, evaluated the statistical differences (n=6,
*0.01<p≤0.05, **0.001<p≤0.01, ***p≤0.001, ns=not
significant). Experiments were repeated three times.
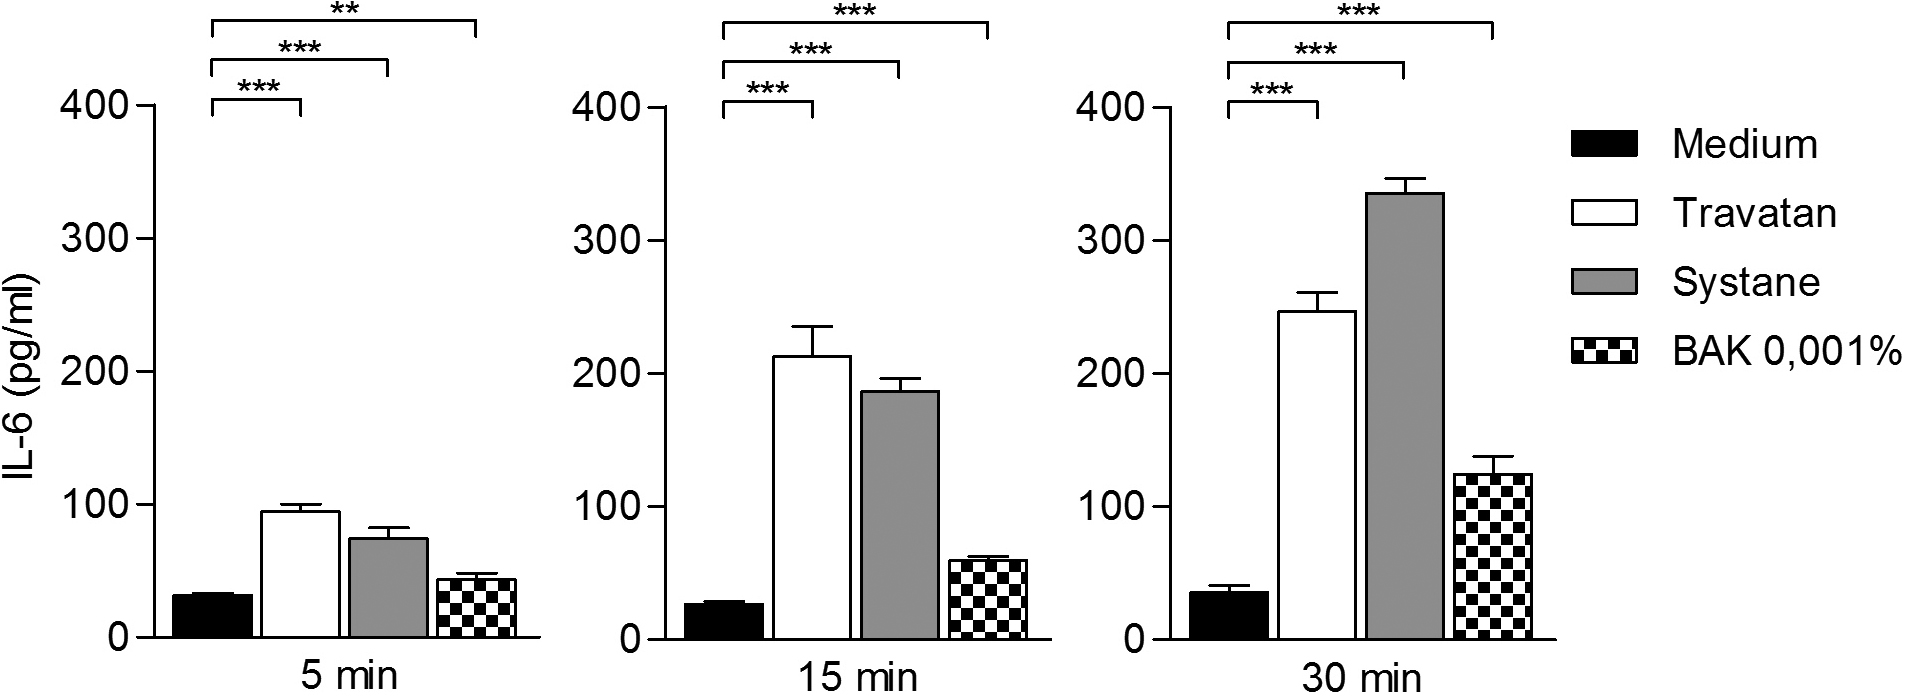
 Figure 4
of Paimela, Mol Vis 2012; 18:1189-1196.
Figure 4
of Paimela, Mol Vis 2012; 18:1189-1196.