Figure 1. FN staining, LM staining, NSE staining, and TEM image of trabecular meshwork cells. A: Fibronectin (FN) staining (400×). B: Laminin (LM) staining (400×). C: Neuron-specific enolase (NSE) staining (5,000×). D: Transmission electron microscopy (TEM) image.
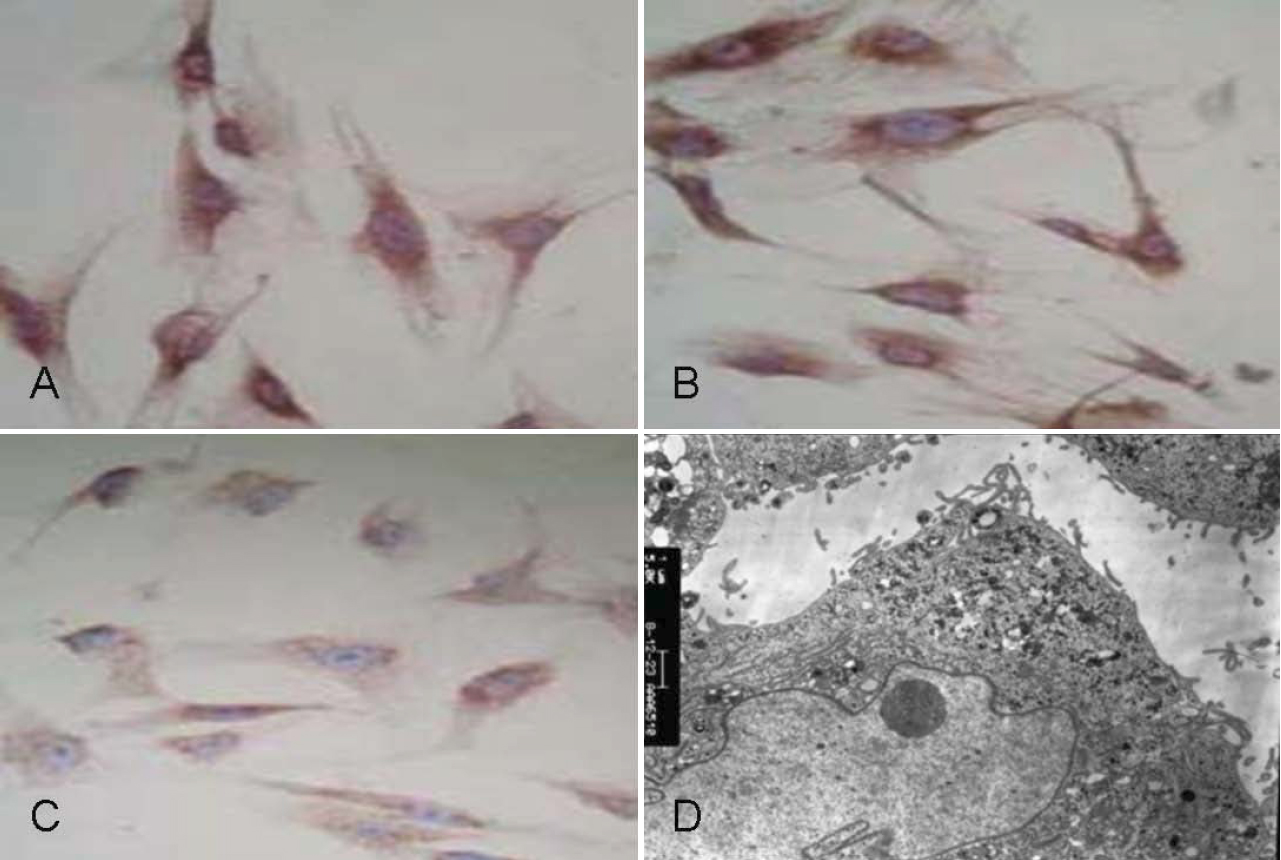
 Figure 1 of
Guo, Mol Vis 2012; 18:1175-1181.
Figure 1 of
Guo, Mol Vis 2012; 18:1175-1181.