Figure 2. Western blot analysis of alpha1 GABAA, GABAB and rho1 GABAC receptors in the chick cornea and retina. A: This panel shows one intense band (approximately 43 kDa) for β-actin and one intense band (approximately 51 kDa) for alpha1 GABAA receptors (α1) both in cornea (C) and in retina (R). B: This panel shows one intense band (approximately 43 kDa) for β-actin both in cornea (C) and in retina (R), and one intense
band (approximately 130 kDa) for GABAB receptors (B) in retina (R) but not in cornea (C). C: This panel shows one intense band (approximately 43 kDa) for β-actin, and one intense band (approximately 48 kDa) for rho1 GABAC receptors (ρ1) both in cornea (C) and in retina (R).
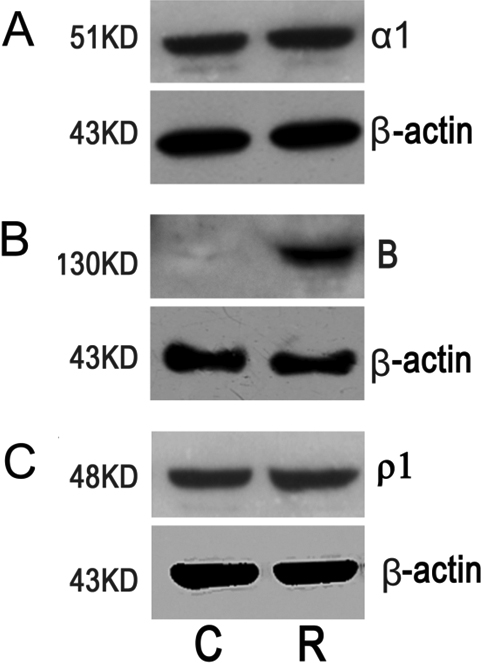
 Figure 2 of
Cheng, Mol Vis 2012; 18:1107-1114.
Figure 2 of
Cheng, Mol Vis 2012; 18:1107-1114.