Figure 4. Graph of IOP elevation for 2 weeks after treatment with bead injection. Mean intraocular pressure difference (mm Hg) between
injected eye and fellow eye at various times after injection for Aca23 (blue) and wild type (red) mice. Significantly higher
mean IOP difference at 14 days in Aca23 group compared to wild type (*p=0.005, Mann–Whitney test); other time periods had
no significant mean IOP difference between strains (all p>0.06). Area under curve (positive integral IOP) for two groups not
significantly different (see Results Section).
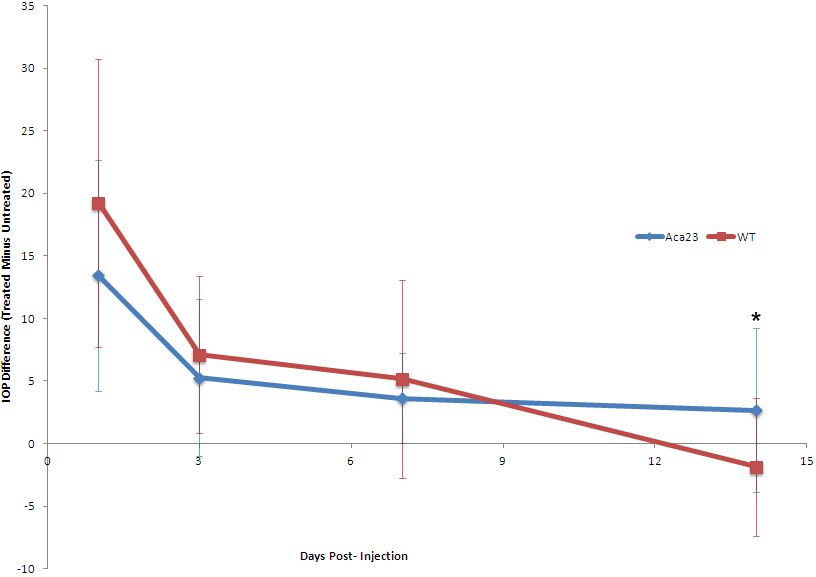
 Figure 4 of
Steinhart, Mol Vis 2012; 18:1093-1106.
Figure 4 of
Steinhart, Mol Vis 2012; 18:1093-1106.