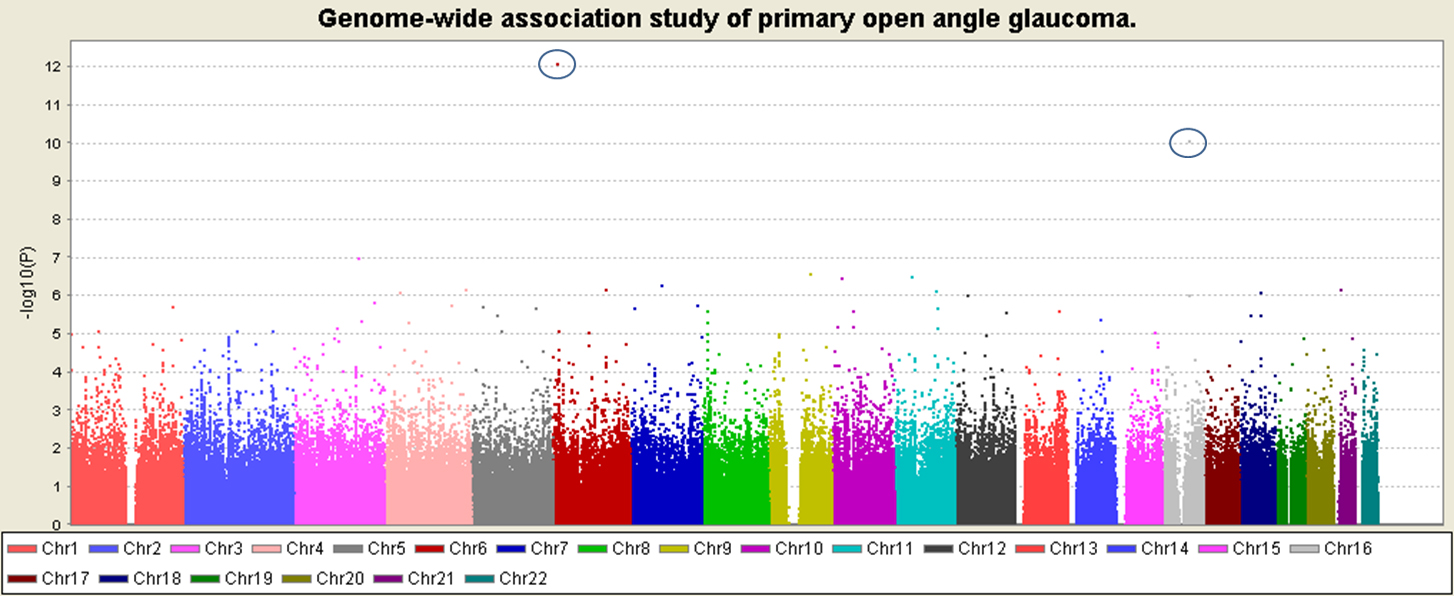
Figure 2. A Manhattan plot of the
discovery sample GWAS results. This Manhattan plot shows the
results of the discovery sample GWAS for all autosomes. Results
are plotted as –log10 of the p-value. The top two results are
circled, on chromosome 6 and chromosome 16. No other SNPs reach
a stringent genome-wide significance level of 10
-8.
This plot was produced using
Haploview.
 Figure 2
of Gibson, Mol Vis 2012; 18:1083-1092.
Figure 2
of Gibson, Mol Vis 2012; 18:1083-1092.