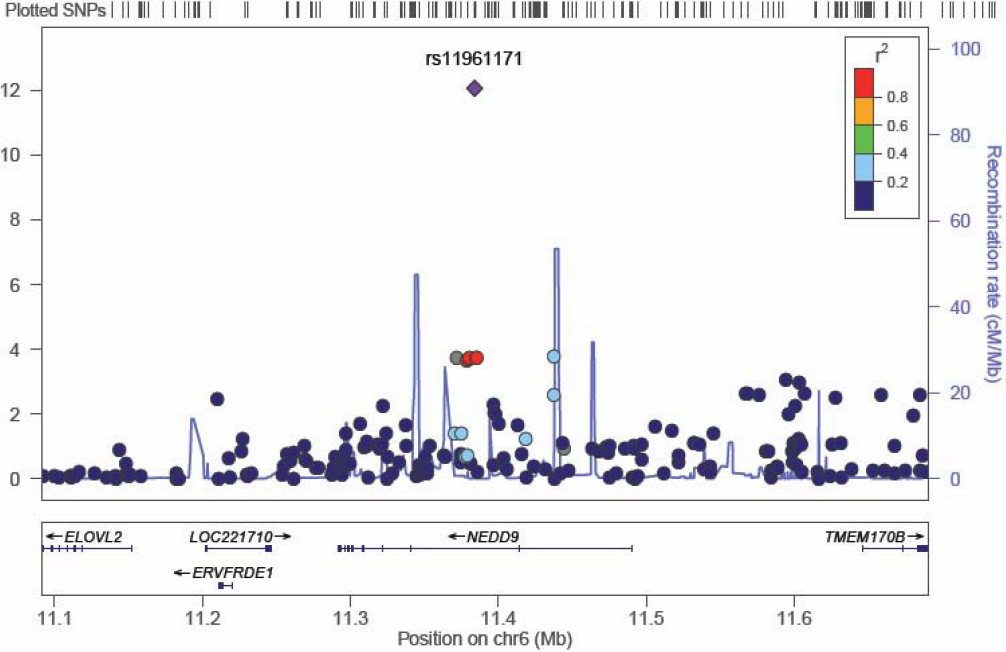
Figure 1. A plot of the most significant region in the discovery sample GWAS. This plot shows the region around the most significant
result in the discovery sample GWAS. SNPs are plotted as the -log10 of the p-value. The plot was produced using
LocusZoom.
 Figure 1 of
Gibson, Mol Vis 2012; 18:1083-1092.
Figure 1 of
Gibson, Mol Vis 2012; 18:1083-1092.