Figure 6 of
Yu, Mol Vis 2012; 18:1074-1082.
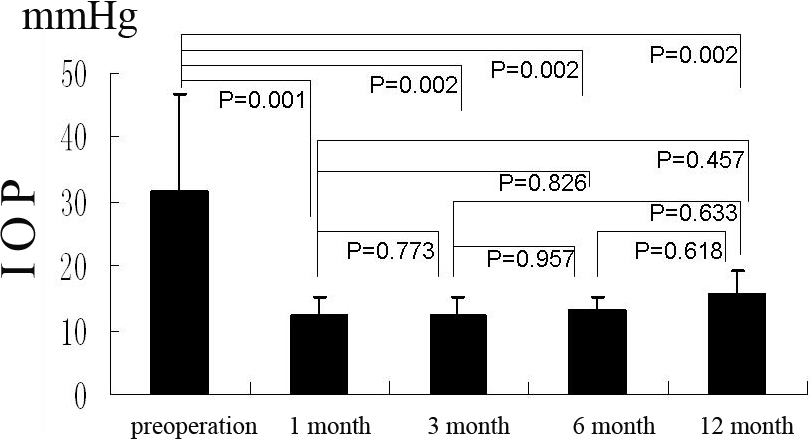
Figure 6.
In group B, the IOP (in terms of Goldman IOP) pre-operation and at 1 month, 3 month, 6 month, and 12 month after operation, the bars mean the average of the test, the error bars mean standard deviation.
 Figure 6 of
Yu, Mol Vis 2012; 18:1074-1082.
Figure 6 of
Yu, Mol Vis 2012; 18:1074-1082.