Figure 2 of
Avila, Mol Vis 2012; 18:1068-1073.
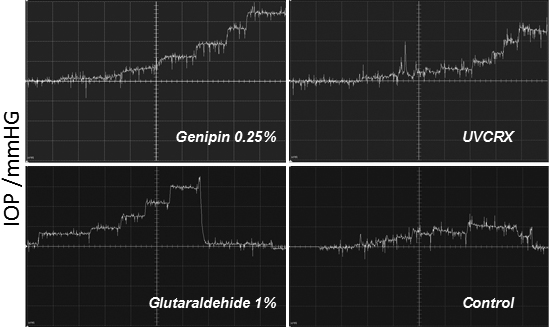
Figure 2.
Representative traces of IOP Changes in treated eyes with different crosslinkers. Every vertical square correspond to 5 mmHg.
 Figure 2 of
Avila, Mol Vis 2012; 18:1068-1073. Figure 2 of
Avila, Mol Vis 2012; 18:1068-1073.
Figure 2 of
Avila, Mol Vis 2012; 18:1068-1073. Figure 2 of
Avila, Mol Vis 2012; 18:1068-1073.